

Role of spike timing in the forelimb somatosensory cortex of the rat
- PMID: 15317852
- PMCID: PMC6729767
- DOI: 10.1523/JNEUROSCI.2523-04.2004
Role of spike timing in the forelimb somatosensory cortex of the rat
Abstract
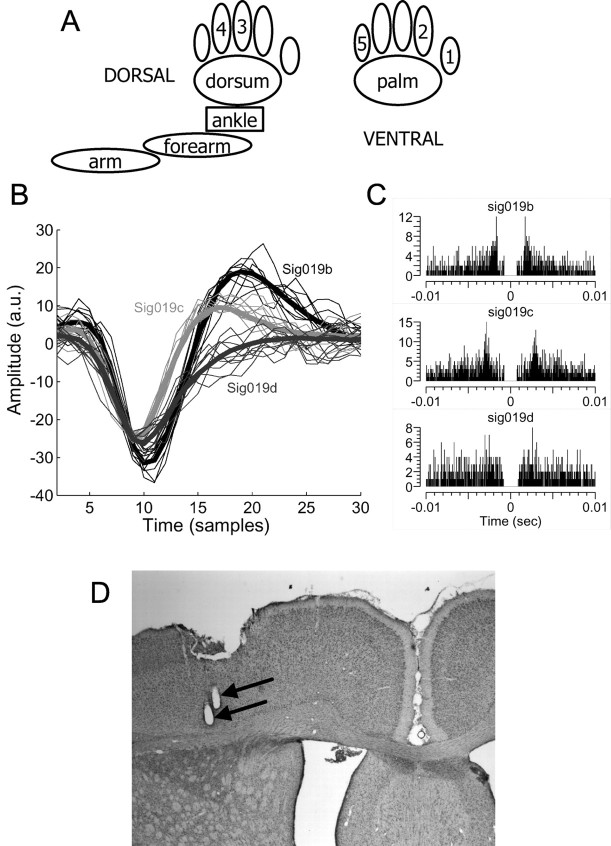
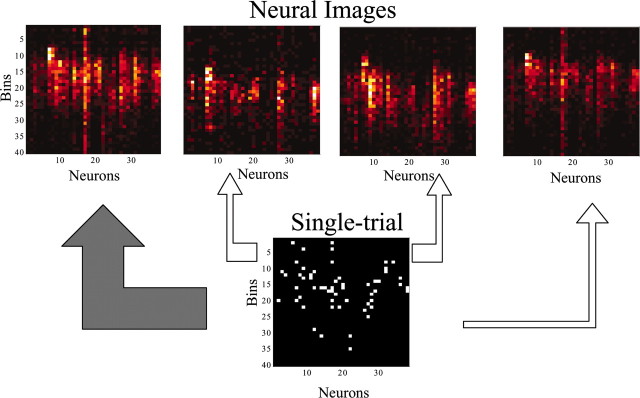
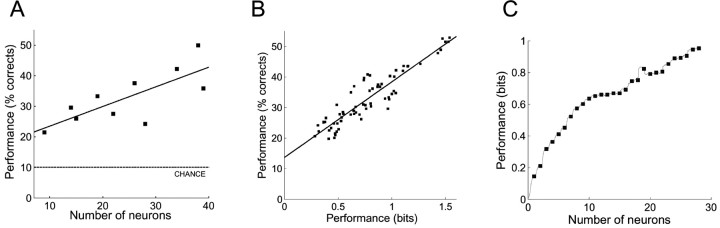
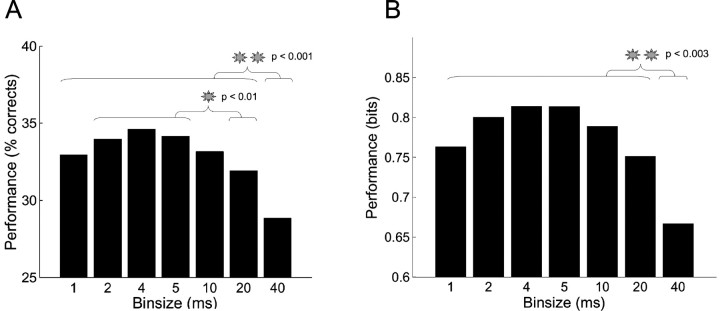
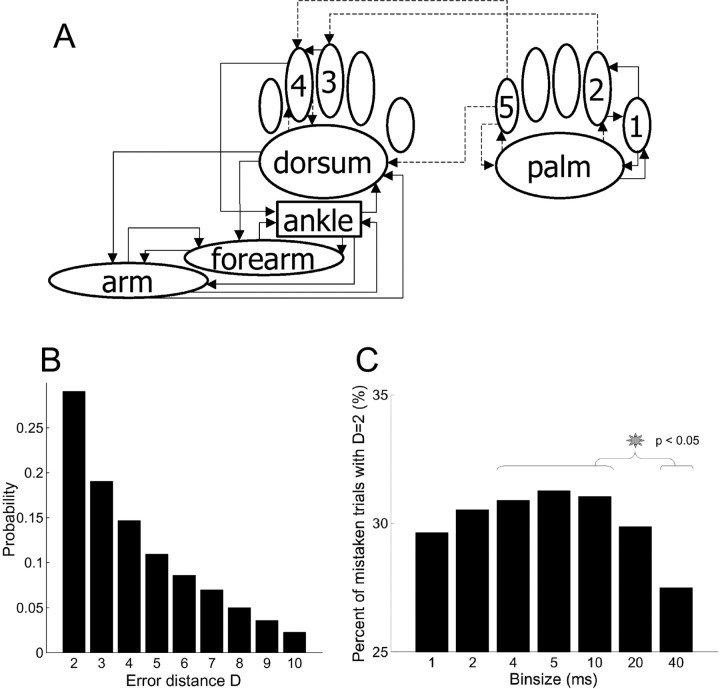
The aim of this study was to test the hypothesis that the significance of spike timing in somatosensory processing is not a specific feature of the whisker cortex but a more general characteristic of the primary somatosensory cortex. We recorded ensembles of neurons using microwire arrays implanted in the deep layers of the forelimb region of the rat primary somatosensory cortex in response to step stimuli delivered to the cutaneous surface of the contralateral body. We used a recently developed peristimulus time histogram (PSTH)-based classification method to investigate the temporal precision of the code by evaluating how changing the bin size (from 40 to 1 msec) would affect the ability of the ensemble responses to discriminate stimulus location on a single-trial basis. The information related to the discrimination was redundantly distributed within the ensembles, and the ability to discriminate stimulus location increased when decreasing the bin size, reaching a maximum at 4 msec. In our experiment, at 4 msec bin size the first spike per neuron after the stimulus conveyed almost as much information as the entire responses, so the temporal precision of the code was preserved in the first spikes. Subsequent spikes were less frequent but conveyed more information per spike. Finally, not only the trials correctly classified but also the trials incorrectly classified conveyed information about stimulus location with a similar temporal precision. We conclude that the role of spike timing in cortical somatosensory processing is not an exclusive feature of the highly specialized rat trigeminal system, but a more general property of the rat primary somatosensory cortex.
Figures
Similar articles
-
Computational role of large receptive fields in the primary somatosensory cortex.J Neurophysiol. 2008 Jul;100(1):268-80. doi: 10.1152/jn.01015.2007. Epub 2008 Apr 9. J Neurophysiol. 2008. PMID: 18400959 Free PMC article.
-
The role of individual spikes and spike patterns in population coding of stimulus location in rat somatosensory cortex.Biosystems. 2002 Oct-Dec;67(1-3):187-93. doi: 10.1016/s0303-2647(02)00076-x. Biosystems. 2002. PMID: 12459298
-
Structure of the excitatory receptive fields of infragranular forelimb neurons in the rat primary somatosensory cortex responding to touch.Cereb Cortex. 2006 Jun;16(6):791-810. doi: 10.1093/cercor/bhj023. Epub 2005 Aug 24. Cereb Cortex. 2006. PMID: 16120794
-
Neural coding: A single neuron's perspective.Neurosci Biobehav Rev. 2018 Nov;94:238-247. doi: 10.1016/j.neubiorev.2018.09.007. Epub 2018 Sep 15. Neurosci Biobehav Rev. 2018. PMID: 30227142 Review.
-
Population coding in somatosensory cortex.Curr Opin Neurobiol. 2002 Aug;12(4):441-7. doi: 10.1016/s0959-4388(02)00338-0. Curr Opin Neurobiol. 2002. PMID: 12139993 Review.
Cited by
-
A Bayesian perceptual model replicates the cutaneous rabbit and other tactile spatiotemporal illusions.PLoS One. 2007 Mar 28;2(3):e333. doi: 10.1371/journal.pone.0000333. PLoS One. 2007. PMID: 17389923 Free PMC article.
-
Encoding and decoding touch location in the leech CNS.J Neurosci. 2006 Jul 26;26(30):8009-16. doi: 10.1523/JNEUROSCI.5472-05.2006. J Neurosci. 2006. PMID: 16870746 Free PMC article.
-
Transitioning from global to local computational strategies during brain-machine interface learning.Front Neurosci. 2024 Apr 19;18:1371107. doi: 10.3389/fnins.2024.1371107. eCollection 2024. Front Neurosci. 2024. PMID: 38707591 Free PMC article.
-
Millisecond precision spike timing shapes tactile perception.J Neurosci. 2012 Oct 31;32(44):15309-17. doi: 10.1523/JNEUROSCI.2161-12.2012. J Neurosci. 2012. PMID: 23115169 Free PMC article.
-
Tradeoffs and constraints on neural representation in networks of cortical neurons.J Neurosci. 2010 Jul 14;30(28):9588-96. doi: 10.1523/JNEUROSCI.0661-10.2010. J Neurosci. 2010. PMID: 20631187 Free PMC article.
References
-
- Ahissar E, Sosnik R, Haidarliu S (2000) Transformation from temporal to rate coding in a somatosensory thalamocortical pathway. Nature 406: 302-306. - PubMed
-
- Bar-Gad I, Ritov Y, Bergman H (2001) The neuronal refractory period causes a short-term peak in the autocorrelation function. J Neurosci Methods 104: 155-163. - PubMed
-
- Bialek W, Rieke F, de Ruyter van Steveninck RR, Warland D (1991) Reading a neural code. Science 252: 1854-1857. - PubMed
-
- Borst A, Theunissen FE (1999) Information theory and neural coding. Nat Neurosci 2: 947-957. - PubMed
Publication types
MeSH terms
Grants and funding
LinkOut - more resources
Full Text Sources
Other Literature Sources