. 2004 Aug 18;24(33):7410-9.
doi: 10.1523/JNEUROSCI.1691-04.2004.

Complex locking rather than complete cessation of neuronal activity in the globus pallidus of a 1-methyl-4-phenyl-1,2,3,6-tetrahydropyridine-treated primate in response to pallidal microstimulation

Affiliations

Complex locking rather than complete cessation of neuronal activity in the globus pallidus of a 1-methyl-4-phenyl-1,2,3,6-tetrahydropyridine-treated primate in response to pallidal microstimulation

Izhar Bar-Gad et al. J Neurosci. .

Abstract

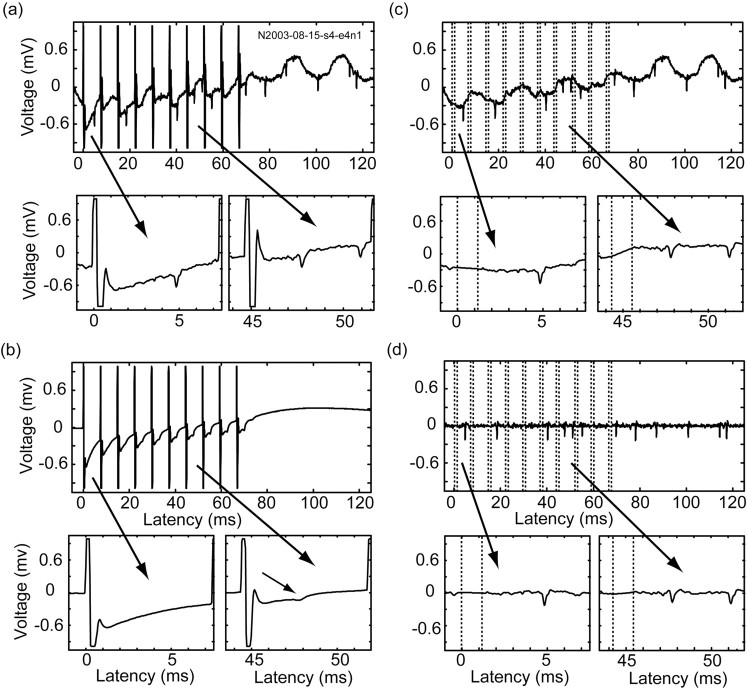
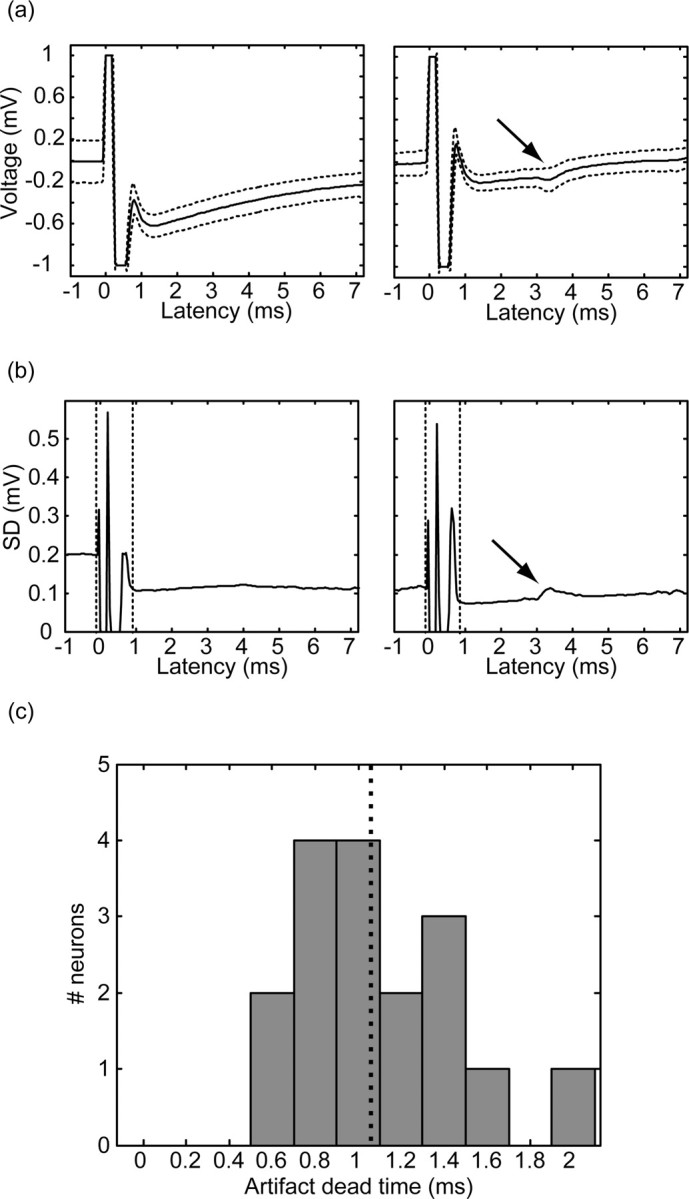
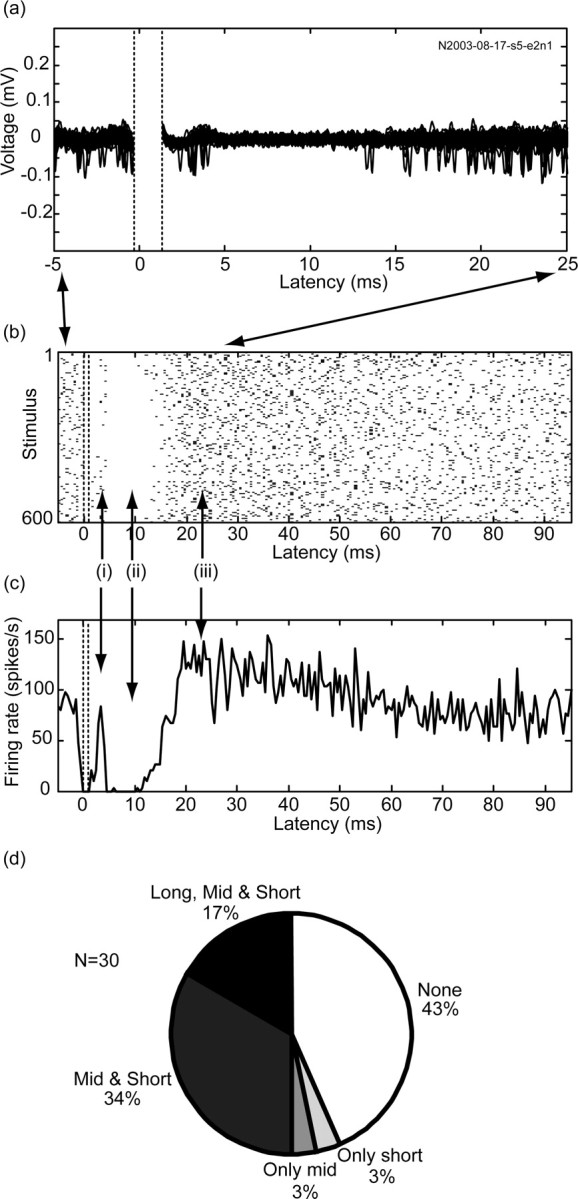
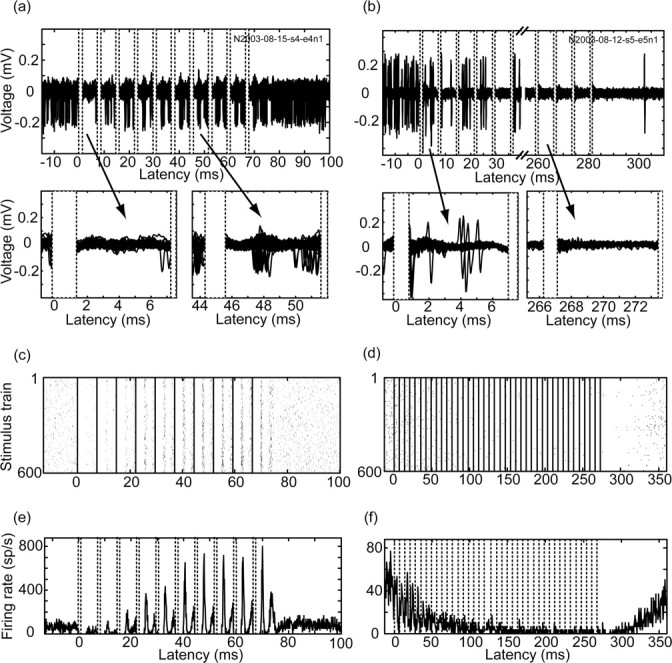
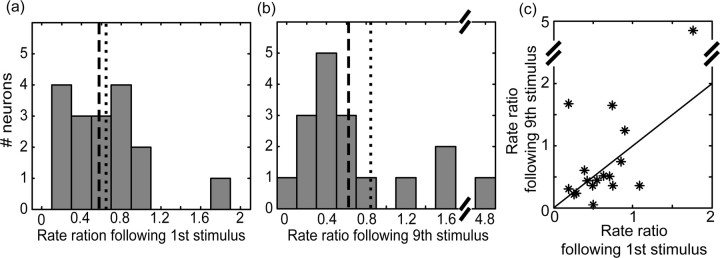
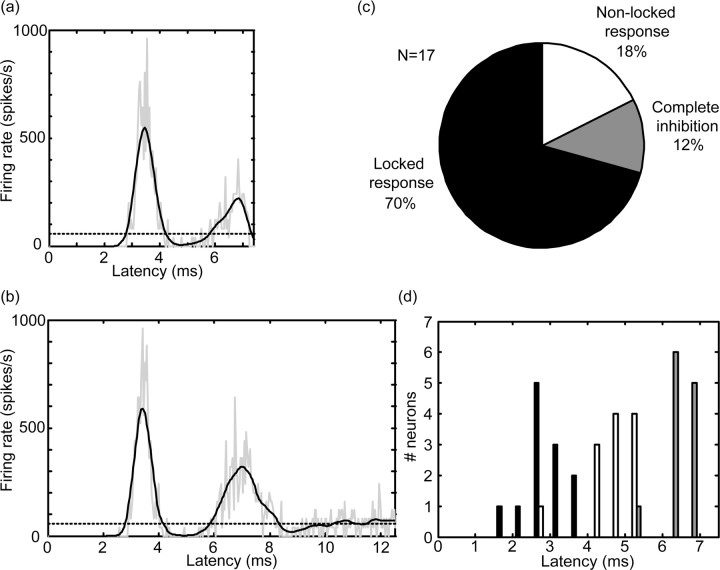
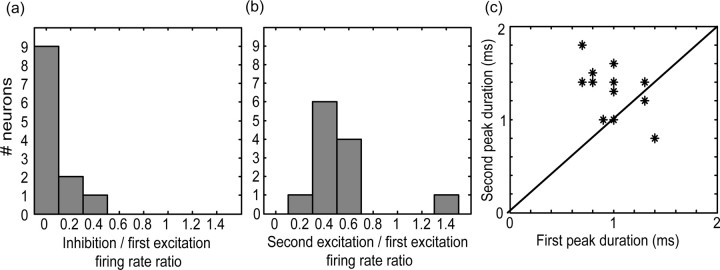
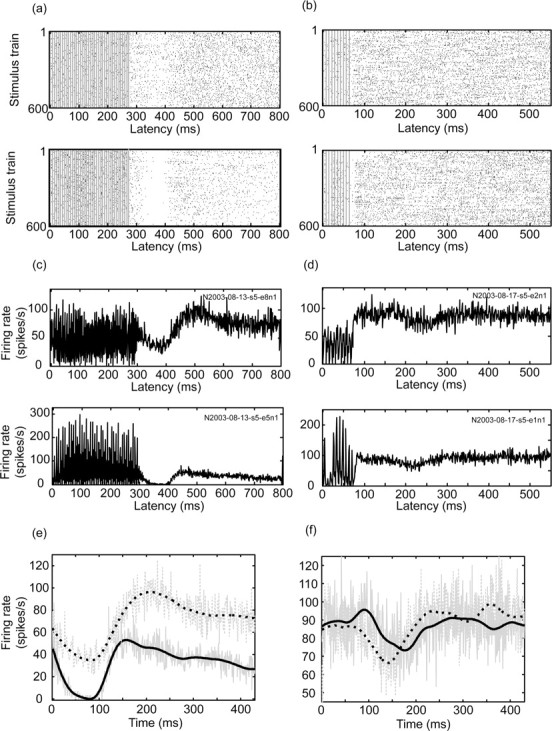
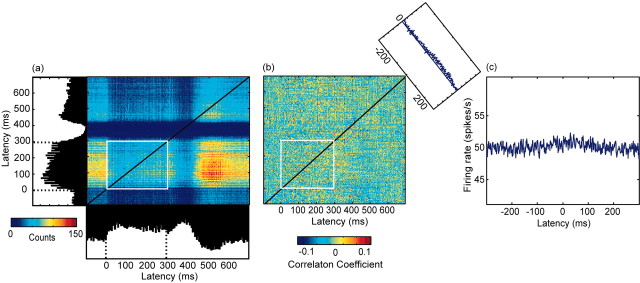
High-frequency stimulation of the globus pallidus (GP) has emerged as a successful tool for treating Parkinson's disease and other motor disorders. However, the mechanism governing its therapeutic effect is still under debate. To shed light on the basic mechanism of deep brain stimulation (DBS), we performed microstimulation in the GP of a 1-methyl-4-phenyl-1,2,3,6-tetrahydropyridine-treated monkey while recording with other microelectrodes in the same nucleus. We used robust methods to reduce the stimulus artifact, and 600-3000 repetitions of a single stimulus and of high-frequency short trains (10-40 stimuli), enabling high temporal resolution analysis of neural responses. Low-frequency stimulation yielded a typical three-stage response: short-term (2-3 msec duration) activity, followed by mid-term (15-25 msec) inhibition, and occasionally longer-term (30-40 msec) excitation. Trains of high-frequency stimuli elicited complex locking of the response to the stimuli in most neurons. The locking displayed a stereotypic temporal structure consisting of three short-duration (1-2 msec) phases: an initial (mean latency = 2.9 msec) excitation followed by an inhibition (4.6 msec) and a second excitation (6.3 msec). The change in the mean firing rate was mixed; the majority of the neurons displayed partial inhibition during the stimulus train. Slow inhibitory and excitatory multiphase changes in the firing rate were observed after the stimulus trains. The activity of neurons recorded simultaneously displayed rate correlations but no spike-to-spike correlations. Our results suggest that the effect of DBS on the GP is not complete inhibition but rather a complex reshaping of the temporal structure of the neuronal activity within that nucleus.


Figures

Figure 1.
Figure 1.
Stimulus artifact removal process. A sample recording is shown during a train of HFS. The traces are shown throughout the removal process and a magnified view is provided for the times after the first (left) and seventh (right) stimuli. a, Original recorded signal. The 50 Hz artifacts are clearly seen because of the broadband (1-6000 Hz) filter setting. The sequence indicates the number of the neuron with spikes that formed the basis of the figure. b, Mean shapes of the stimulus artifacts were averaged over 600 trains. The short arrow points to the part of the pattern that derives from the locking of the neural response to the stimulus. c, d, The same signal is shown after the artifact pattern removal, before (c) and after (d) digital high-pass (300 Hz) filtering. The dotted lines identify the recording dead time (stimulation parameters: biphasic stimulation; each phase, 0.2 msec/40 μA; 600 trains of 140 Hz; 10 stimuli per train; 500 msec between trains).
Figure 2.
Figure 2.
Stimulation artifact dead time. a, The mean shape of the stimulus artifact (same neuron as in Fig. 1; solid line) surrounded by a single SD offset (dotted line) for the time after the first (left) and seventh (right) stimuli. The arrow points to the part of the pattern that is derived from the locking of the neuronal response to the stimulus. b, The SD is shown for the same neuron and time (solid line). The dead time boundaries are marked by dotted lines. c, The distribution of the dead times of 17 pallidal neurons after a central (fifth) stimulus within trains of HFS; the mean length of the dead time is marked as a dotted line.
Figure 3.
Figure 3.
Activity during low-frequency stimulation. Response of a single pallidal neuron is shown as the following. a, An overlay of 50 signal traces (stimulus 400→449) after stimulus artifact removal and filtering. The dead time boundaries are marked by dotted lines. The sequence indicates the number of the neuron with spikes that formed the basis of the figure. b,A raster plot of all repetitions (n = 600). c, A PSTH showing a response consisting of three phases: i, short-term response, ii, mid-term inhibition, and iii, long-term excitation (stimulation parameters: biphasic stimulation; each phase, 0.2 msec/40 μ A; 600 repetitions; 10 Hz). Both the raster and PSTH are in 0.5 msec resolution and aligned to the stimulus. d, Distribution of pallidal responses to low-frequency stimulation.
Figure 4.
Figure 4.
Activity during high-frequency stimulus train. The intratrain responses of two pallidal neurons to HFS: a time-locked excitatory response (a, c, e) within the train (same neuron as in Fig. 1) and an inhibited response (b, d, f) within the train (monophasic stimulation; 0.2 msec/40 μA; 600 trains of 140 Hz; 40 stimuli per train; 500 msec intertrain interval). a, b, Raw trace of a single stimulus train. The sequence indicates the number of the neuron with spikes that formed the basis of the figure. c, d, Raster display of the firing of multiple train repetitions.e, f, PSTH of the response. All figures are aligned to the first stimulus within the train.
Figure 5.
Figure 5.
Changes in firing rate during high-frequency stimulus train. Distribution of the normalized firing rate after the first (a) and ninth (b) stimulus within the train (normalized rate = mean firing rate within the period after the dead time/mean rate before the trains). The mean rate is shown as a dotted line, and the mean rate after removal of the outlier is shown as a dashedline. c, The ratio of the normalized rates after the first and ninth stimuli; the diagonal marks a ratio of 1.
Figure 6.
Figure 6.
Locking of firing to the stimulus during high-frequency train. A single example (same neuron as in Fig. 1) of responses to different stimuli within the train (the gray line shows the response in ∼0.04 msec bins; the black line shows the smoothed response using least squares quadratic polynomial fitting of 24 ∼1 msec bins; the horizontal dotted line marks the mean firing rate before the stimuli). a, Response to the ninth stimulus; the second excitation is truncated by the next stimulus. b, Response to the last (10th) stimulus, showing the complete time course of the second excitation. c, Distribution of the responses of all pallidal neurons recorded during high-frequency trains. d, Distribution of the latencies of the first excitation (black bars), inhibition (white bars), and second excitation (gray bars).
Figure 7.
Figure 7.
Partial locking during the high-frequency train. a, Histogram of the ratio of the firing rate during the inhibition separating the peaks to the maximal firing rate during the first excitation. b, Histogram of the ratio of the maximal firing rates during the first and second excitations. c, Scatter plot of the width of the first peak at half height versus the width of the second peak at half height.
Figure 8.
Figure 8.
Long-term changes in activity after high-frequency stimulus trains. The long-term responses of two pairs of neurons; each pair was recorded simultaneously during the same stimulus. a, c, e, Biphasic stimulation (each phase, 0.2 msec/40 μA; 600 trains of 140 Hz; 40 stimuli per train; 500 msec intertrain interval). b, d, f, Biphasic stimulation (each phase, 0.2 msec/40 μ A; 600 trains of 140 Hz; 10 stimuli per train; 500 msec intertrain interval). a, b, Raster display of the firing of all train repetitions; the gray lines denote the stimuli. c, d, PSTH of the response to the stimulation trains. Both the raster display and the PSTH are aligned to the first stimulus within the train and are in 1 msec bins. The sequence indicates the number of the neuron with spikes that formed the basis of the figure. e, f, PSTH of the period after the train: the original PSTH of the two neurons in 1 msec bins (gray solid and dotted line) and after smoothing using least squares quadratic polynomial fitting of 100 msec (black solid and dotted line); the PSTH is aligned to 10 msec after the last stimulus in the train.
Figure 9.
Figure 9.
Stimulation effect on correlations between simultaneously recorded neurons. The dynamic, stimulus-dependent nature of the correlation between a pair of neurons (same neurons as in Fig. 8a,c,e). a, JPSTH of the activity of the neurons aligned to the first stimulus in the train. The PSTHs of the two neurons are shown on the sides of the JPSTH. The stimulation train boundaries are marked by the white square in the JPSTH and by dotted lines in the PSTH. The figure is cyclic, because the interval between trains is 500 msec; thus, 100 msec before the first stimulus in the train follows 400 msec after the last stimulus in the train. b, Normalized JPSTH after subtraction of the PSTH product. The sum of the central diagonals (the averaged cross-correlation function during the stimulation period) is shown at the right tip of the normalized JPSTH. The bin size in a and b is 5 msec. c, Cross-correlation between the neurons before the initiation of the stimulation (period of 2 min). The cross-correlation is shown in 1 msec bins after a 5 msec moving average smoothing.

Similar articles

Cited by

References

    1. Abeles M, Goldstein MHJ (1977) Multispike train analysis. IEEE Trans Biomed Eng 65: 762-773.
    1. Aertsen AM, Gerstein GL, Habib MK, Palm G (1989) Dynamics of neuronal firing correlation: modulation of “effective connectivity.” J Neurophysiol 61: 900-917. - PubMed
    1. Anderson ME, Postupna N, Ruffo M (2003) Effects of high-frequency stimulation in the internal globus pallidus on the activity of thalamic neurons in the awake monkey. J Neurophysiol 89: 1150-1160. - PubMed
    1. Ashby P, Strafella A, Dostrovsky JO, Lozano A, Lang AE (1998) Immediate motor effects of stimulation through electrodes implanted in the human globus pallidus. Stereotact Funct Neurosurg 70: 1-18. - PubMed
    1. Bar-Gad I, Morris G, Bergman H (2003) Information processing, dimensionality reduction and reinforcement learning in the basal ganglia. Prog Neurobiol 71: 439-473. - PubMed

Publication types

LinkOut - more resources