Comparative Study
. 2004 Nov 1;560(Pt 3):821-30.
doi: 10.1113/jphysiol.2004.069559. Epub 2004 Aug 19.

Cochlear function in Prestin knockout mice

Affiliations
Comparative Study

Cochlear function in Prestin knockout mice

M A Cheatham et al. J Physiol. .

Abstract

Gross-potential recordings in mice lacking the Prestin gene indicate that compound action potential (CAP) thresholds are shifted by approximately 45 dB at 5 kHz and by approximately 60 dB at 33 kHz. However, in order to conclude that outer hair cell (OHC) electromotility is associated with the cochlear amplifier, frequency selectivity must be evaluated and the integrity of the OHC's forward transducer ascertained. The present report demonstrates no frequency selectivity in CAP tuning curves recorded in homozygotes. In addition, CAP input-output functions indicate that responses in knockout mice approach those in controls at high levels where the amplifier has little influence. Although the cochlear microphonic in knockout mice remains approximately 12 dB below that in wild-type mice even at the highest levels, this deficit is thought to reflect hair cell losses in mice lacking prestin. A change in OHC forward transduction is not implied because knockout mice display non-linear responses similar to those in controls. For example, homozygotes exhibit a bipolar summating potential (SP) with positive responses at high frequencies; negative responses at low frequencies. Measurement of intermodulation distortion also shows that the cubic difference tone, 2f(1)-f(2), is approximately 20 dB down from the primaries in both homozygotes and their controls. Because OHCs are the sole generators of the negative SP and because 2f(1)-f(2) is also thought to originate in OHC transduction, these data support the idea that forward transduction is not degraded in OHCs lacking prestin. Finally, application of AM1-43, which initially enters hair cells through their transducer channels, produces fluorescence in wild-type and knockout mice indicating transducer channel activity in both inner and outer hair cells.


Figures

Figure 1
Figure 1. Compound action potential (CAP) thresholds
Means and standard deviations are shown for CAP thresholds in F4 generation mice. Although wild-type and heterozygous mice demonstrate similar sensitivity, that in homozygotes is shifted in a frequency-dependent manner.
Figure 2
Figure 2. CAP input–output functions
Means and standard deviations are provided for CAP input–output functions at 6, 12 and 32 kHz in all three genotypes. Responses in homozygotes are reduced when compared to controls, be they wild-type or heterozygous mice.
Figure 3
Figure 3. CAP tuning curves
Simultaneous masking curves for a 12 kHz probe are provided for wild-type (+/+), heterozygous (+/−) and homozygous (−/−) mice. Means and standard deviations are plotted. The average probe level in both wild-type and heterozygous mice was 53 dB; that in homozygotes, 86 dB. These levels are indicated by the isolated symbols at 12 kHz. No frequency selectivity is seen in knockout mice.
Figure 4
Figure 4. Cochlear microphonic (CM) at 16 kHz
CM input–output functions at 16 kHz are shown for all three genotypes in F4 generation mice. Wild-type data shown on the left represent the averaged responses from six mice; those for heterozygotes in the centre and homozygotes on the right represent the averaged responses from five mice. Results from Liberman et al. (2002) at the same stimulus frequency are appended and plotted with dashed lines and open symbols. The CM in F4 generation wild-type and heterozygous mice is considerably larger than that for the F2 mice whose data are presented in the Liberman et al. (2002) report.
Figure 5
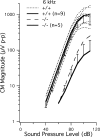
Figure 5. CM at 6 kHz
Mean CM input–output functions are plotted for wild-type (n = 9) and homozygous (n = 5) mice at 6 kHz. Standard deviations are provided in only one direction to foster comparisons between knockouts with the largest responses and their wild-type controls. Functions without symbols represent results from the homozygote with the largest CM responses (dashed lines) and from the nine wild-type mice used to obtain the mean (dotted lines).
Figure 6
Figure 6. Time waveforms of gross cochlear potentials
Averaged response waveforms are shown on the top row for wild-type mice and the bottom row for knockout mice. Data on the left were obtained for 32 kHz at 99 dB; those on the right for 6 kHz at 100 dB. Positive SPs are recorded at 32 kHz and negative SPs are recorded at 6 kHz in both genotypes.
Figure 7
Figure 7. Intermodulation distortion observed in the CM
Input-output functions are provided for f1 alone (circles) and for 2f1f2 (triangles) in wild-type (A) and knockout (B) mice. The abscissa represents the level of f2, with f1 being 14 dB higher than f2. C, the level of 2f1f2 measured relative to that of f1 in decibels. In knockouts and their controls, the cubic difference tone is ∼20 dB below f1.
Figure 8
Figure 8. AM1-43 fluorescence
A and B, fluorescence for wild-type and knockout mice, respectively. In these experiments the AM1-43 was injected in vivo at P12 and the mice were killed at P37 for the wild-type mouse and at P32 for the knockout mouse. For the in vitro experiments in C and D, the wild-type control (6 weeks 5 days) was exposed to 0.3 μm AM1-43 for 2 min, while the knockout (7 weeks 2 days) was exposed for 2 min 26 s. In no case did outer hair cells (OHCs) fail to fluoresce. E and F, the effect of pre-incubation in 1 mm dihydrostreptomycin (DHSM) for 5 min 32 s. For these control experiments, the concentration of AM1-43 was 3.5 μm AM1-43. One ear from this wild-type mouse (6 weeks 4 days) was exposed to AM1-43 alone for 1 min 27 s, while the other ear was exposed for 1 min 22 s following pre-incubation with DHSM. The organ of Corti was wet dissected and then mounted in an anti-fading medium and a coverslip was applied; this sometimes results in a folding of the tissue as in E where the inner hair cells are difficult to resolve. AF, calibration bar = 15 μm.

References

    1. Ashmore JF. A fast motile response in guinea pig outer hair cells: the cellular basis of the cochlear amplifier. J Physiol. 1987;388:323–347. - PMC - PubMed
    1. Belyantseva IA, Adler HJ, Curi R, Frolenkov GI, Kachar B. Expression and localization of Prestin and the sugar transporter GLUT-5 during development of electromotility in cochlear outer hair cells. J Neurosci. 2000;20:1–5. RC116. - PMC - PubMed
    1. Brownell WE, Bader CR, Bertrand D, de Ribaupierre Y. Evoked mechanical responses of isolated outer hair cells. Science. 1985;227:194–196. - PubMed
    1. Cheatham MA, Dallos P. Intermodulation components in inner hair cell and organ of Corti responses. J Acoust Soc Am. 1997;102:1038–1048. - PubMed
    1. Cody AR, Russell IJ. The responses of hair cells in the basal turn of the guinea-pig cochlea to tones. J Physiol. 1987;383:551–569. - PMC - PubMed

Publication types

MeSH terms

LinkOut - more resources