. 2004 Oct 15;560(Pt 2):491-503.
doi: 10.1113/jphysiol.2004.071225. Epub 2004 Aug 19.

Activity-dependent excitability changes in hippocampal CA3 cell Schaffer axons

Affiliations

Activity-dependent excitability changes in hippocampal CA3 cell Schaffer axons

A F Soleng et al. J Physiol. .

Abstract

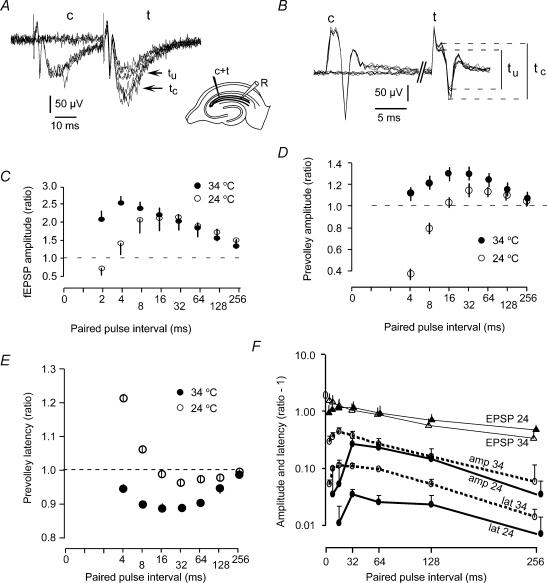
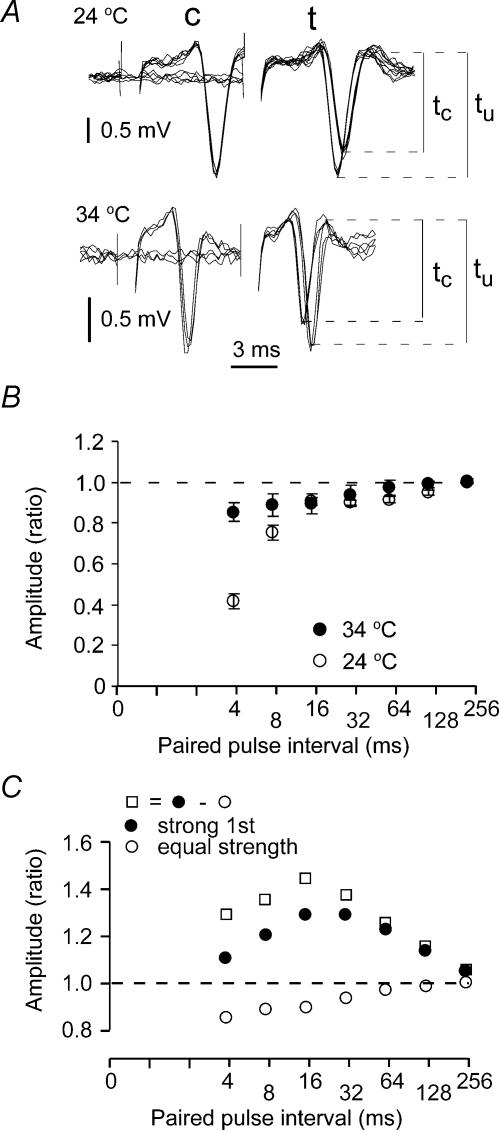
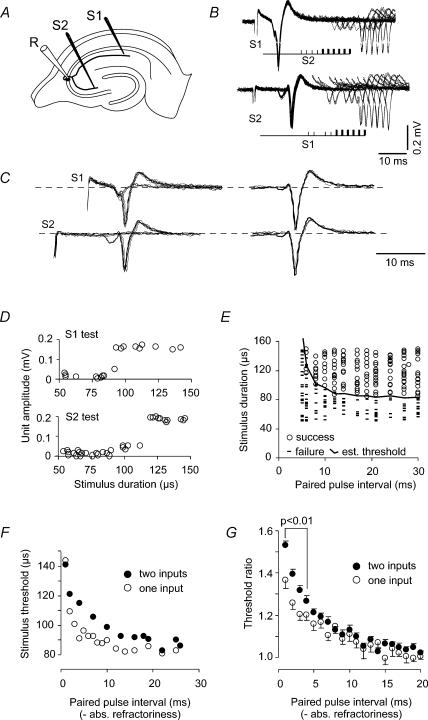
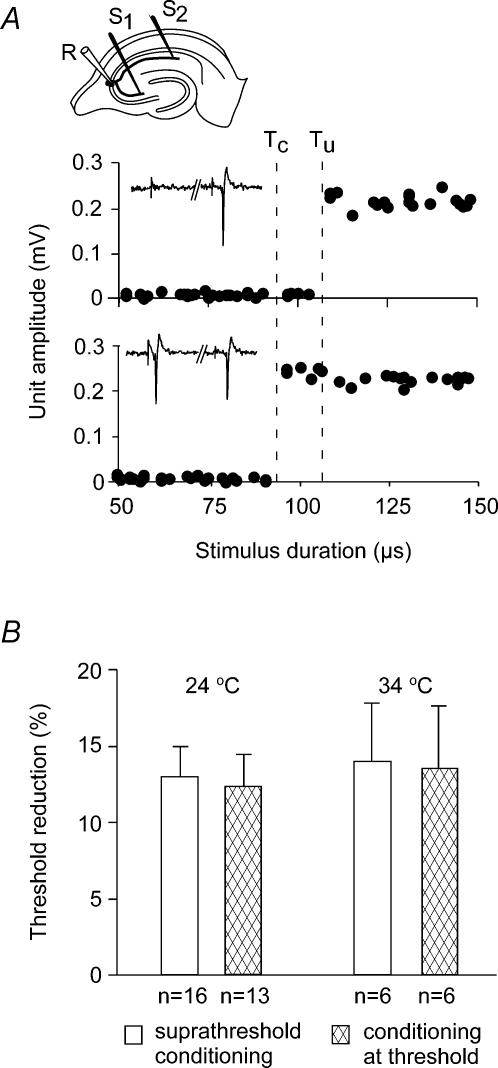
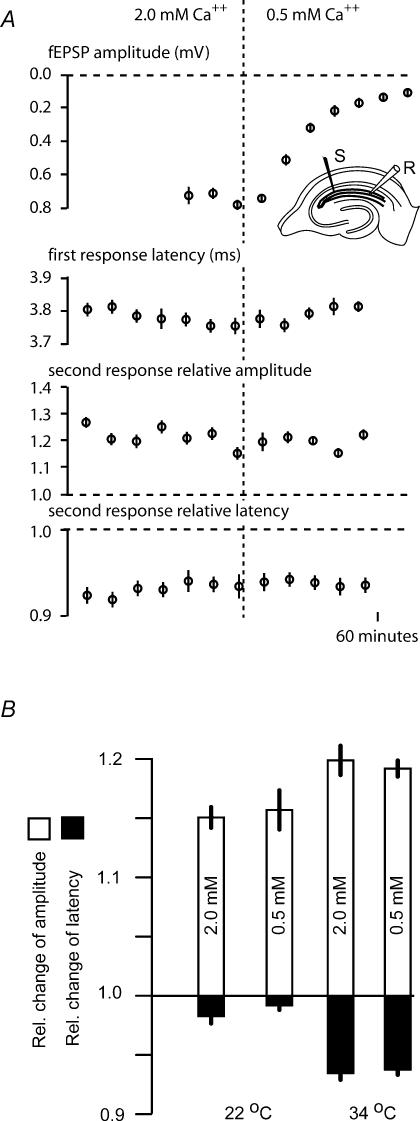
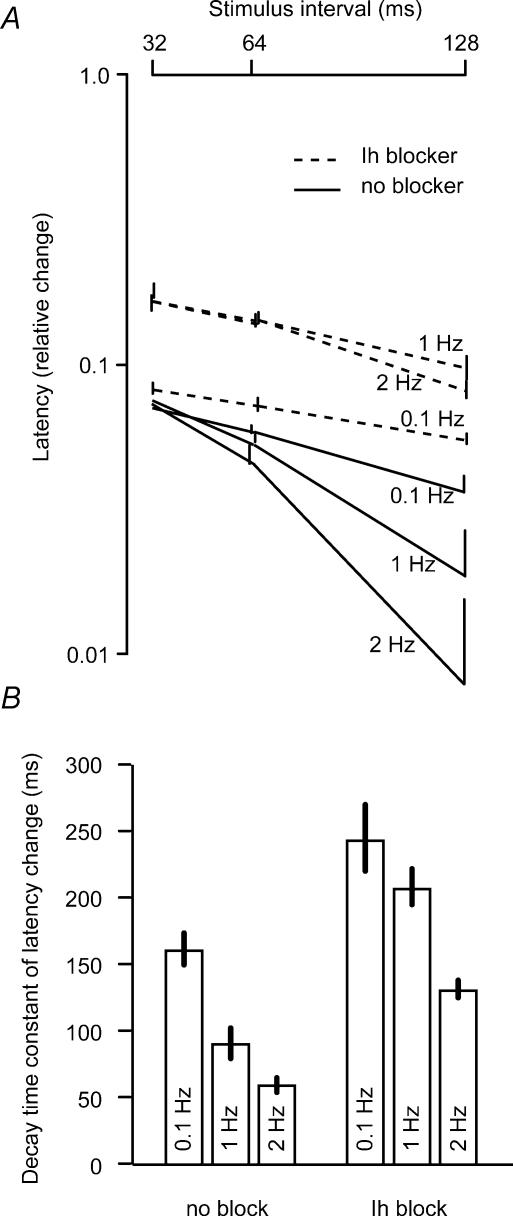
The membrane potential changes following action potentials in thin unmyelinated cortical axons with en passant boutons may be important for synaptic release and conduction abilities of such axons. In the lack of intra-axonal recording techniques we have used extracellular excitability testing as an indirect measure of the after-potentials. We recorded from individual CA3 soma in hippocampal slices and activated the axon with a range of stimulus intensities. When conditioning and test stimuli were given to the same site the excitability changes were partly masked by local effects of the stimulating electrode at intervals < 5 ms. Therefore, we elicited the conditioning action potential from one axonal branch and tested the excitability of another branch. We found that a single action potential reduced the axonal excitability for 15 ms followed by an increased excitability for approximately 200 ms at 24 degrees C. Using field recordings of axonal action potentials we show that raising the temperature to 34 degrees C reduced the magnitude and duration of the initial depression. However, the duration of the increased excitability was very similar (time constant 135 +/- 20 ms) at 24 and 34 degrees C, and with 2.0 and 0.5 mM Ca2+ in the bath. At stimulus rates > 1 Hz, a condition that activates a hyperpolarization-activated current (Ih) in these axons, the decay was faster than at lower stimulation rates. This effect was reduced by the Ih blocker ZD7288. These data suggest that the decay time course of the action potential-induced hyperexcitability is determined by the membrane time constant.


Figures

Figure 1
Figure 1. Paired-pulse facilitation and excitability changes at the CA3–CA1 synapse
A, delivery of a conditioning pulse 32 ms prior to a test pulse of identical strength facilitated the test response. c, conditioning response; t, test response; tu and tc, unconditioned and conditioned test response, respectively. Three conditioned and three unconditioned responses are superimposed. The first biphasic response is the compound action potential, while the second negative wave is the field EPSP. Insert, electrode for conditioning and test stimulus (c + t) and recording electrode (R) in the Schaffer collateral area. B, the compound action potential response (tu) was increased (tc) when a stronger conditioning pulse (c) was presented 32 ms before the test pulse. Three traces with conditioning stimuli are superimposed on three without conditioning. c, t, tu, and tc, same as in A. C, time course of the paired-pulse facilitation of field EPSP (fEPSP) at 24°C (n = 7) and 34°C (n = 7). The ratio between conditioned and unconditioned test responses is plotted against the interstimulus interval (logarithmic axis). D, time course of the increase in compound action potential with stronger conditioning than test stimulus. At both 24°C (n = 7) and 34°C (n = 7) the increase in the amplitude of the compound action potential lasted for > 250 ms. An initial depression was observed at 24°C. E, time course of paired-pulse modulation of the latency of the compound action potential at 24°C (n = 5) and 34°C (n = 5). The ratio between conditioned and unconditioned test response latency was reduced for more than 100 ms following activity. At low temperature there was an initial latency increase. F, the data in C–E plotted with logarithmic y-axis and linear interval axis. One is subtracted from the ratios to make zero on the y-axis mean no change. The decay rates, estimated as the average decay in intervals 64–128 and 128–256 ms, were (in ms): −448 ± 74, −478 ± 36 (EPSP 24 and 34°C); −135 ± 24, −123 ± 13 (amplitude 24 and 34°C); −134 ± 28, −149 ± 20 (latency 24 and 34°C), respectively.
Figure 2
Figure 2. Paired-pulse modulation of the compound action potential
A, a conditioning pulse 8 ms prior to a test pulse of identical strength prolonged the latency to the compound action potential at 24°C and reduced the latency at 34°C. The amplitude was reduced at both temperatures. c, conditioning response; t, test response; tu and tc, unconditioned and conditioned test response, respectively. Three conditioned and three unconditioned responses are superimposed. B, time course of the paired-pulse depression of the compound action potential amplitude at 24°C (n = 5) and 34°C (n = 5). The ratio between conditioned and unconditioned test response amplitudes is plotted against the interstimulus interval. C, time course of the estimated hyperexcitability following activity. The hyperexcitability effect is estimated by subtracting the overlapping depression illustrated in B from the response amplitudes in Fig. 1D (34°C).
Figure 3
Figure 3. Single action potentials reduced the Schaffer axon excitability for 15 ms (at 24°C)
A, stimulation of two axonal branches (S1, S2) originating from a single CA3 pyramidal cell. B, collision tests confirmed that S1 and S2 originated from the same CA3 cell: a suprathreshold pulse given to one axonal branch (S1) caused a period of absolute refractoriness in the other input (S2), and vice versa. For both traces, the initial negative deflection represents the conditioning action potential, while the following peaks represent the response to stimuli at the test branch. Four stimulus intervals (thin bars) giving failures and six stimuli (thick bars) giving somatic discharge are shown. C, the somatic responses, both after S1 and S2 stimuli (left traces), were often mixed with responses from other smaller units. The background was isolated as the response that was left during the refractory periods. By averaging and subtracting this background, the somatic responses were very similar in shape, both from S1 and S2 stimuli (right traces). D, single unit recordings activated from two separate axonal branches show their all-or-none behaviour over a range of stimulation strengths. E, spike responses (○) and failures (–) of CA3 somata in response to Schaffer stimuli preceded by conditioning of a separate axonal branch. After the absolute refractory period (4 ms), the activation threshold was increased for another 10 ms. At each interstimulus interval, the activation threshold was estimated by calculating the average between the strongest stimulus giving failure and the weakest giving an anti-dromic action potential. F, estimated activation threshold for a Schaffer collateral branch following suprathreshold stimulation at the same (S1, ○) or a different axonal branch (S2, •). The threshold increase was smaller when both conditioning and test stimuli were given by the same electrode (S1). Both plots were horizontally shifted by subtracting the absolute refractory period. G, threshold change as a function of the paired-pulse interval. At all paired-pulse intervals the threshold change is given as a ratio between the conditioned and unconditioned thresholds. The period of increased threshold lasted up to 15 ms following a single action potential. During the first 4 ms the threshold increase was significantly lower (P < 0.01) when the suprathreshold pulse was delivered to the test branch, S1 (n = 20), compared to S2 (n = 33). At higher intervals the difference was not significant.
Figure 4
Figure 4. Activity-dependent threshold reduction in a single CA3 axonal branch conditioned by a separate branch
A, a single CA3 unit, identified by its all-or-none response, was anti-dromically activated from two separate axonal branches, a Schaffer collateral and a CA3 associational branch. The Schaffer collateral activation threshold (Tu) was clearly reduced following a suprathreshold conditioning pulse (Tc) delivered to the separate branch. B, the threshold reduction at ∼30-ms interval was similar when comparing a constant suprathreshold conditioning to a conditioning of threshold strength (leading to intermittent failures) at 24°C (n = 16 and n = 13, respectively) and 34°C (n = 6 for both).
Figure 5
Figure 5. The hyperexcitability was similar with 2.0 and 0.5 mm Ca2+ in extracellular solution
A, while the field EPSP (fEPSP; first plot) was almost abolished by reducing the extracellular Ca2+ concentration from 2.0 to 0.5 mm, the latency of the compound action potential was not changed (second plot). The relative change in latency (third plot) and amplitude (fourth plot) in paired-pulse experiments (32 ms interval, with strong first stimulus) was not changed either. B, the average latency reduction and amplitude increase in five experiments similar to the one in A. The measurements were taken during the last 10 min with 2.0 mm Ca2+, and between 15 and 25 min after changing to 0.5 mm Ca2+. The hyperexcitability is a little stronger (more amplitude increase and latency decrease) at 34 than 24°C, but results are not significantly different with 2.0 or 0.5 mm Ca2+.
Figure 6
Figure 6. Manipulation of the decay rate of the hyperexcitability by stimulation frequency and Ih blocker
A, the hyperexcitability was measured as the relative change in latency (logarithmic axis) induced by a conditioning stimulus at 32, 64 and 128 ms intervals at 34°C. The paired-pulse tests were repeated at 0.1, 1 and 2 Hz. The lowest frequency gave a decay similar to that in Fig. 1F, but the faster frequencies gave faster decays. With 25 μm ZD7288, the decays were slower at all frequencies (dashed lines). B, the average time constant of the decay of the latency change at the two intervals (32–64 and 64–128 ms) was reduced by increasing the stimulation frequency, and the decay was slower at all frequencies with the Ih blocker ZD7288.

Similar articles

Cited by

References

    1. Andersen P. Interhippocampal impulses II. Apical dendritic activation of CA1 neurons. Acta Physiol Scand. 1960;48:178–208. - PubMed
    1. Barrett EF, Barrett JN. Intracellular recording from vertebrate myelinated axons: mechanism of the depolarizing afterpotential. J Physiol. 1982;323:117–144. - PMC - PubMed
    1. Barrett EF, Morita K, Scappaticci KA. Effects of tetraetylammonium on the depolarizing after-potential and passive properties of lizard myelinated axons. J Physiol. 1988;402:65–78. - PMC - PubMed
    1. Bartesaghi R. Supernormal excitability of fibers of the dorsal hippocampal commissure. Exp Neurol. 1987;96:208–213. - PubMed
    1. Blight AR, Someya S. Depolarizing afterpotentials in myelinated axons of mammalian spinal cord. Neuroscience. 1985;15:1–12. - PubMed