. 2004 Sep;16(9):2265-77.
doi: 10.1105/tpc.104.023135. Epub 2004 Aug 19.

From endonucleases to transcription factors: evolution of the AP2 DNA binding domain in plants

Affiliations

From endonucleases to transcription factors: evolution of the AP2 DNA binding domain in plants

Enrico Magnani et al. Plant Cell. 2004 Sep.

Abstract

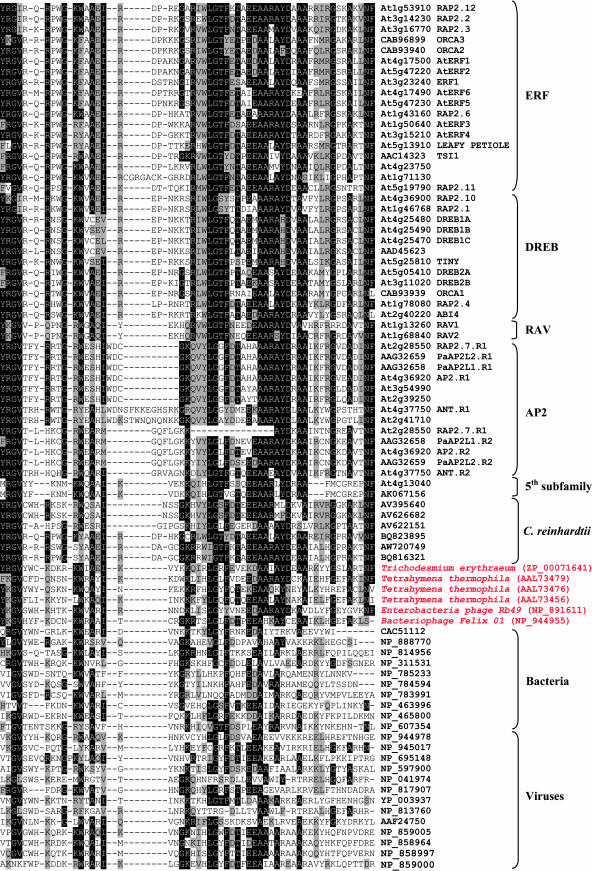
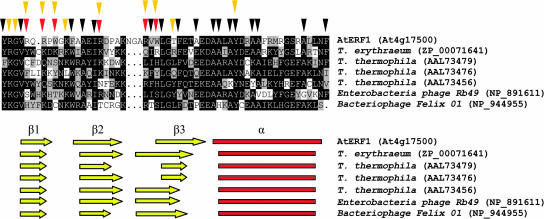
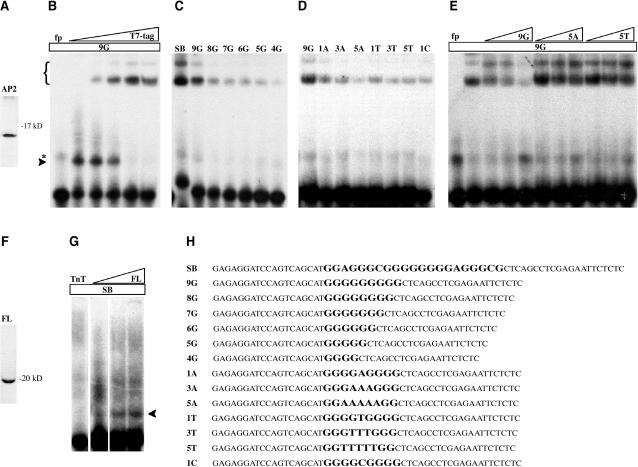
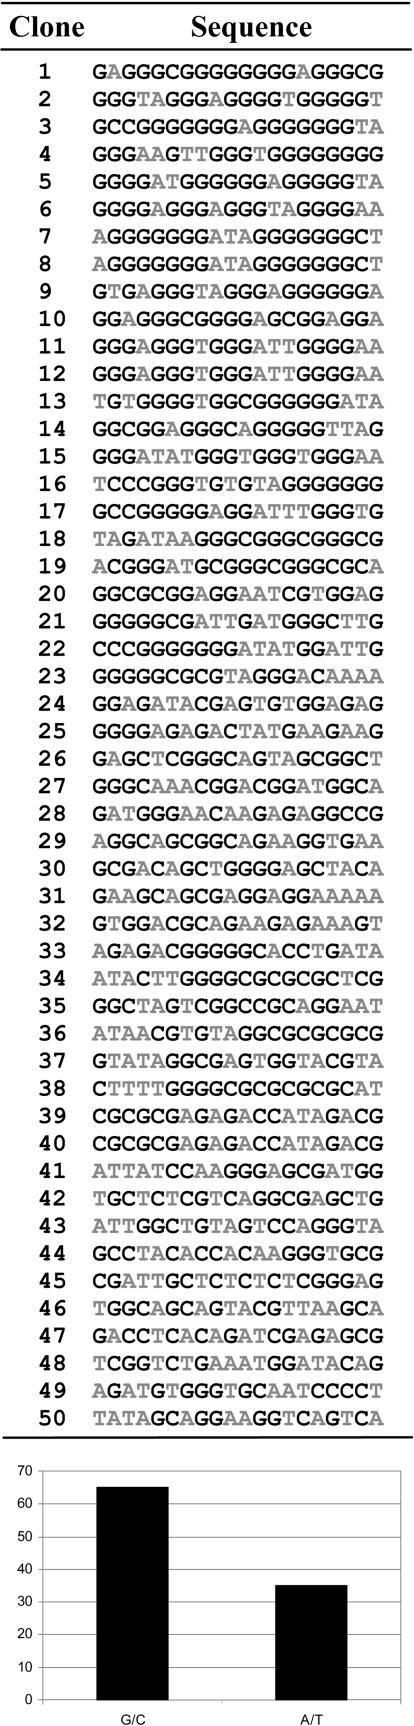
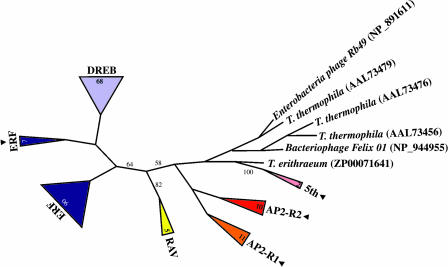
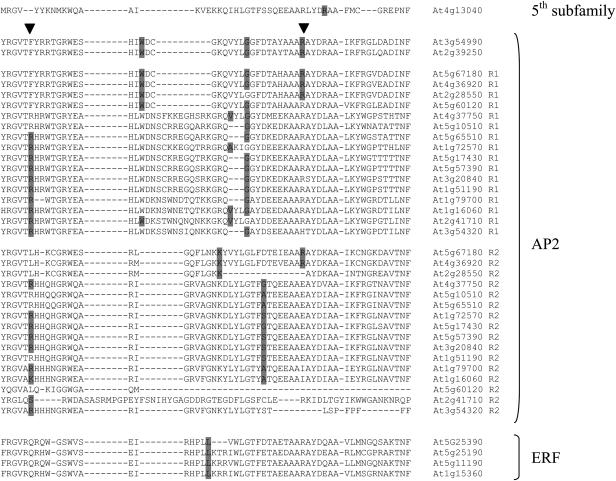
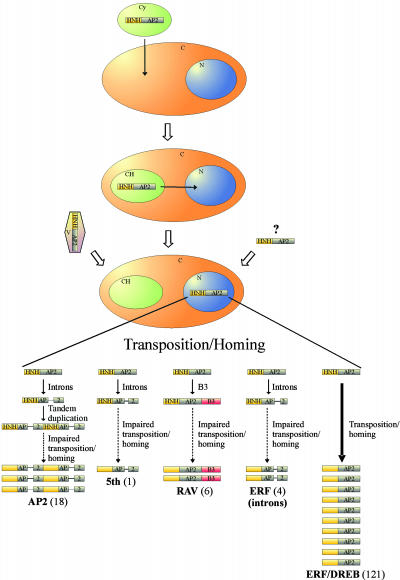
All members of the AP2/ERF family of plant transcription regulators contain at least one copy of a DNA binding domain called the AP2 domain. The AP2 domain has been considered plant specific. Here, we show that homologs are present in the cyanobacterium Trichodesmium erythraeum, the ciliate Tetrahymena thermophila, and the viruses Enterobacteria phage Rb49 and Bacteriophage Felix 01. We demonstrate that the T. erythraeum AP2 domain selectively binds stretches of poly(dG)/poly(dC) showing functional conservation with plant AP2/ERF proteins. The newly discovered nonplant proteins bearing an AP2 domain are predicted to be HNH endonucleases. Sequence conservation extends outside the AP2 domain to include part of the endonuclease domain for the T. erythraeum protein and some plant AP2/ERF proteins. Our phylogenetic analysis of the broader family of AP2 domains supports the possibility of lateral gene transfer. We hypothesize that a horizontal transfer of an HNH-AP2 endonuclease from bacteria or viruses into plants may have led to the origin of the AP2/ERF family of transcription factors via transposition and homing processes.


Figures

Figure 1.
Figure 1.
AP2 Homologs. Muscle 3.2 alignment of a pool of plant AP2 domains representative of all the AP2/ERF subfamilies, the C. reinhardtii AP2 domains, and the sequences found outside the plant kingdom. The nonplant AP2 domains that align to the entire plant AP2 domain are annotated in red.
Figure 2.
Figure 2.
Conservation of Functional Amino Acids and Secondary Structure. Muscle 3.2 alignment of the AtERF1 AP2 domain and the nonplant AP2 domains. Red and yellow triangles indicate AtERF1 base-contacting and backbone-contacting amino acids, respectively. The hydrophobic residues stabilizing the AtERF1 AP2 domain are marked by black triangles. A schematic representation of the secondary structure as determined in the AtERF1 structure and predicted by 3D-pssm is drawn below the alignment. Yellow arrows indicate β strands, and red rectangles indicate α helices.
Figure 3.
Figure 3.
The T. erythraeum AP2 Domain Selectively Binds DNA. (A) The T. erythraeum AP2 domain (AP2) was fused to a T7 and His tag, and ∼1 μg of recombinant expressed and purified protein was separated by SDS-PAGE. The molecular mass of the recombinant protein was 12 kD. (B) EMSA analysis of purified T. erythraeum AP2 domain fused to a T7 and His tag. The protein was incubated with the 9G probe (Figure 3H). The shift is indicated by an arrowhead. In the free probe lane (fp), an artifact was detected at a molecular weight slightly higher than the protein–DNA complexes (indicated by an asterisk). Increasing amounts of anti T7-tag antibody led to a supershift (indicated by brackets). (C) EMSA analysis of purified T. erythraeum AP2 domain fused to a T7 and His tag. The protein was incubated with seven different probes (Figure 3H): SB, 9G, 8G, 7G, 6G, 5G, and 4G. Anti T7-tag antibodies were added to all samples. (D) EMSA analysis of purified T. erythraeum AP2 domain fused to a T7 and His tag. The protein was incubated with eight different probes (Figure 3H): 9G, 1A, 3A, 5A, 1T, 3T, 5T, and 1C. Anti T7-tag antibodies were added to all samples. (E) EMSA analysis of purified T. erythraeum AP2 domain fused to a T7 and His tag. The protein was incubated with the 9G probe (Figure 3H). DNA binding specificity was determined by competing with unlabeled 9G, 5A, or 5T probe (Figure 3H) at 10-, 50-, and 100-fold molar excess over labeled probe. Anti T7-tag antibodies were added to all samples. fp, free probe. (F) The T. erythraeum full-length protein was translated in the TnT reaction, labeled in vitro with 35S-Met, separated by SDS-PAGE, and analyzed by autoradiography (see Methods). The molecular mass of the protein was 19 kD. (G) Increasing amounts of the T. erythraeum full-length protein translated in the TnT reaction (triangle named FL) were incubated with the SB probe. The TnT mixture (TnT) was used as a control. (H) List of the probes used for EMSA analysis. The variable region of the probes is in bold and in a larger font.
Figure 4.
Figure 4.
SAAB Assay. Sequences selected with the T. erythraeum AP2 domain against a pool of random oligonucleotides. G/C and A/T bases are in black and gray, respectively. The diagram at the bottom shows the average percentage of G/C and A/T of the clones sequenced.
Figure 5.
Figure 5.
Domain Analysis. (A) Muscle 3.2 alignment of the six nonplant proteins containing an AP2 domain. Black boxes indicate the NUMOD4, HNH, and AP2 domains. Arrowheads mark two conserved Asn that are substituted by Arg in the T. erythraeum domain. (B) Muscle 3.2 alignment of the T. erythraeum predicted HNH domain and the region of the Arabidopsis At4g39780 DREB protein preceding the AP2 domain. A schematic representation of the HNH endonuclease and the At4g39780 protein is drawn above and below the alignment, respectively.
Figure 6.
Figure 6.
Phylogenetic Analysis. NJ tree of plant AP2 domains and the newly discovered AP2 domains outside plants. A total of 187 plant AP2 domains belonging to all the subfamilies of AP2/ERF transcription factors, six C. reinhardtii AP2 domains, and the T. erythraeum, T. thermophila, Enterobacteria phage Rb49, and Bacteriophage Felix 01 AP2 domains were aligned using Muscle 3.2 (see supplemental data online), and a NJ consensus tree was generated from 10,000 bootstrap replications, including groups compatible with the 50% majority rule. Monophyletic branches grouping plant AP2 domains of the same subfamily were collapsed in a triangle showing the name of the subfamily. The numbers of taxa collapsed are indicated in the triangles. Numbers on branches indicate bootstrap values. Only values >50% are shown. Branch lengths are not proportional to the distance between sequences. Black arrowheads indicate branches, including AP2 domains coded by Arabidopsis genes bearing introns.
Figure 7.
Figure 7.
Intron Analysis. Analysis of the introns in the AP2 coding sequence of the Arabidopsis AP2/ERF genes. The AP2 domains coded by the Arabidopsis AP2/ERF genes bearing introns were aligned using Muscle 3.2. The proteins At5g60120, At2g41710, and At3g54320 show degenerated second AP2 repetitions that are not annotated as AP2 domains. The C terminus of the At5g60120 repetition was omitted because no similarity was detected with any AP2 domain. One new member of the AP2 subfamily with respect to the characterization made by Sakuma et al. (2002) is included. The position of intronic sites is highlighted in gray in the protein sequence. Arrowheads indicate conserved sites among first and second AP2 repetitions of the AP2 subfamily.
Figure 8.
Figure 8.
Model for the Evolution of the AP2 DNA Binding Domain in Plants. An HNH-AP2 homing endonuclease may have been transported into plants (C) via the endosymbiosis of an ancestral cyanobacterium (Cy) and may have then moved from the newly formed chloroplast (Ch) into the nucleus (N). Alternatively, it may have been horizontally transferred from viruses (V) or through other lateral gene transfer events. The HNH-AP2 endonuclease may have spread in the genome via transposition and homing processes. An early evolution of introns or B3 domain in the ancestral genes of some of the AP2/ERF subfamilies could have impaired the transposition and homing processes resulting in a reduced number of genes belonging to these subfamilies. Numbers in parentheses indicate the number of members belonging to the specified subfamily in Arabidopsis.

Similar articles

Cited by

References

    1. Allen, M.D., Yamasaki, K., Ohme-Takagi, M., Tateno, M., and Suzuki, M. (1998). A novel mode of DNA recognition by a beta-sheet revealed by the solution structure of the GCC-box binding domain in complex with DNA. EMBO J. 17, 5484–5496. - PMC - PubMed
    1. Altschul, S.F., Gish, W., Miller, W., Myers, E.W., and Lipman, D.J. (1990). Basic local alignment search tool. J. Mol. Biol. 215, 403–410. - PubMed
    1. Altschul, S.F., Madden, T.L., Schaffer, A.A., Zhang, J., Zhang, Z., Miller, W., and Lipman, D.J. (1997). Gapped BLAST and PSI-BLAST: A new generation of protein database search programs. Nucleic Acids Res. 25, 3389–3402. - PMC - PubMed
    1. Bailey, T.L., and Elkan, C. (1994). Fitting a mixture model by expectation maximization to discover motifs in biopolymers. In Proceedings of the Second International Conference on Intelligent Systems for Molecular Biology. (Menlo Park, CA: AAAI Press), pp. 28–36. - PubMed
    1. Baker, S.S., Wilhelm, K.S., and Thomashow, M.F. (1994). The 5′-region of Arabidopsis thaliana cor15a has cis-acting elements that confer cold-, drought- and ABA-regulated gene expression. Plant Mol. Biol. 24, 701–713. - PubMed

MeSH terms