

Discrimination of benign and malignant thyroid nodules by molecular profiling
- PMID: 15319714
- PMCID: PMC1356433
- DOI: 10.1097/01.sla.0000137128.64978.bc
Discrimination of benign and malignant thyroid nodules by molecular profiling
Abstract
Background: The evaluation of thyroid nodules by fine-needle aspiration has been the standard for almost 30 years, despite significant shortcomings in sensitivity and specificity. Recent data from our laboratory have suggested that molecular profiling permits the discrimination of specific types of thyroid nodules. These studies were undertaken to determine whether molecular profiling can discriminate between benign and malignant thyroid nodules with the necessary sensitivity and specificity required of a screening test.
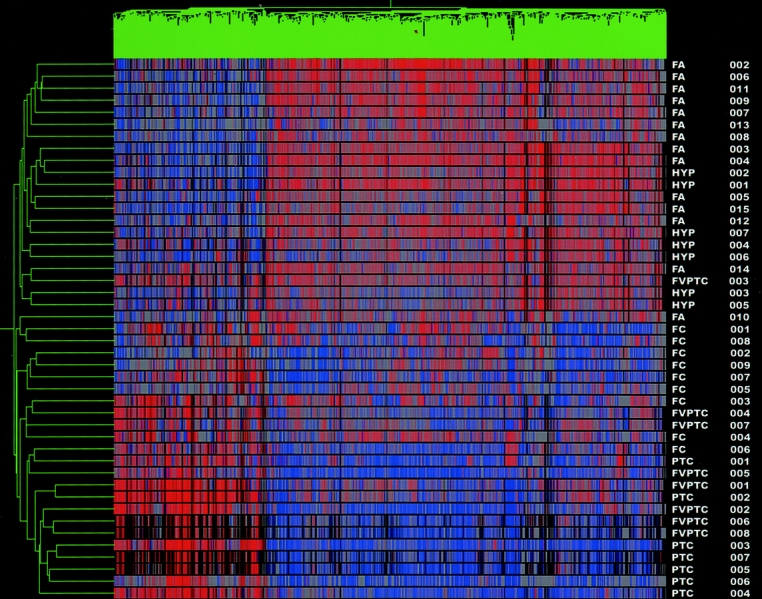
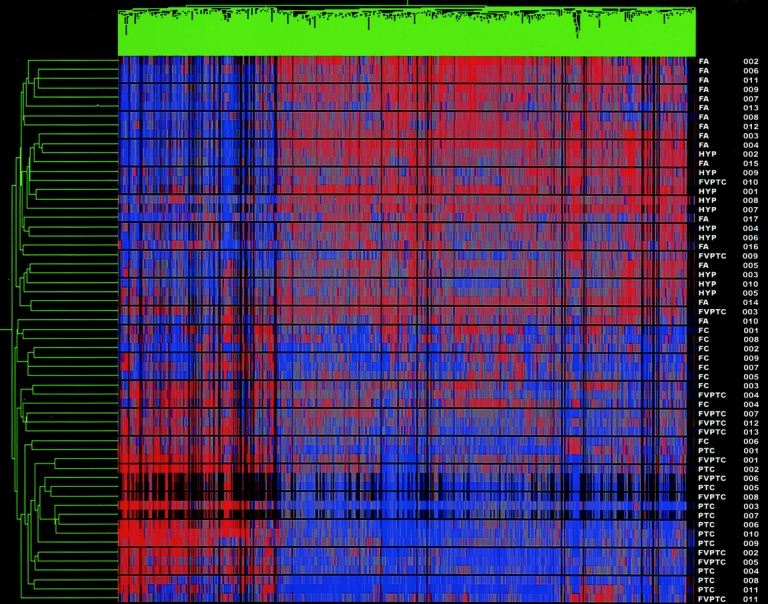
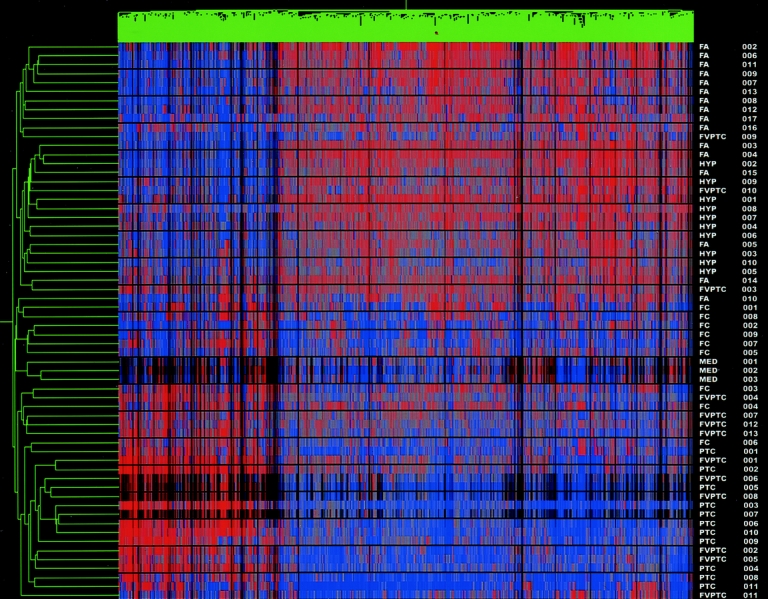
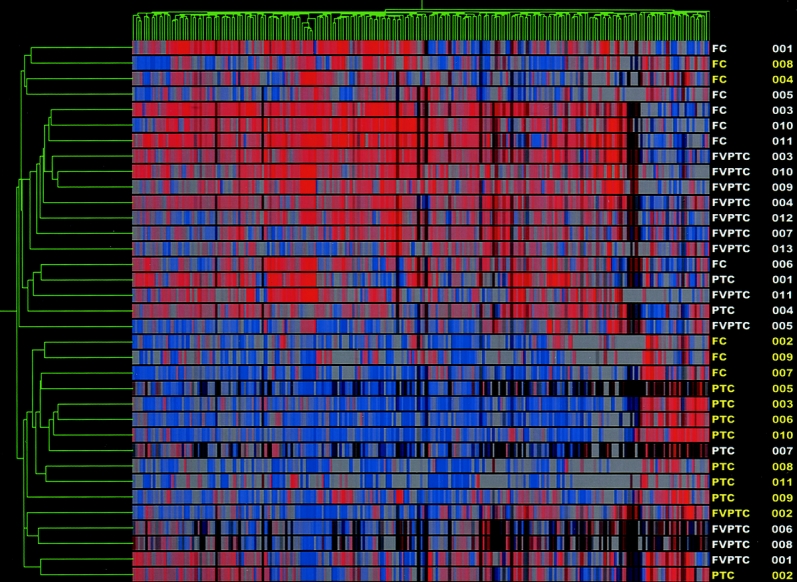
Methods: Molecular profiles of 11 papillary thyroid carcinomas, 13 follicular variant of papillary thyroid carcinomas, 9 follicular thyroid carcinomas, and 26 benign tumors (follicular adenomas and hyperplastic nodules) were analyzed by oligonucleotide microarray analysis. A gene list was created based on 45 samples. Seventeen samples were then added to the analysis as unknowns. A hierarchical clustering analysis was performed on all 62 samples to examine the groups for potential differences and the ability of the gene list to distinguish tumor types.
Results: Cluster analysis of all 62 samples produced 2 distinct groups, 1 containing the carcinomas and 1 containing the benign lesions. The sensitivity for a diagnosis of cancer was 91.7% with a specificity of 96.2% (3 follicular variant of papillary thyroid carcinomas clustered with the benign lesions). The cancer gene profiles contained both known cancer-associated genes (MET, galectin-3) and previously unidentified genes.
Conclusions: Molecular profiling readily distinguishes between benign and malignant thyroid tumors with excellent sensitivity and specificity. Elucidated genes may provide insight into the molecular pathogenesis of thyroid cancer. Gene profiling may significantly enhance the evaluation of thyroid nodules in the future.
Figures
Similar articles
-
Molecular profiling distinguishes papillary carcinoma from benign thyroid nodules.J Clin Endocrinol Metab. 2004 Jul;89(7):3214-23. doi: 10.1210/jc.2003-031811. J Clin Endocrinol Metab. 2004. PMID: 15240595
-
Advancing the molecular diagnosis of thyroid nodules: defining benign lesions by molecular profiling.Thyroid. 2005 Jun;15(6):562-8. doi: 10.1089/thy.2005.15.562. Thyroid. 2005. PMID: 16029122
-
A six-gene model for differentiating benign from malignant thyroid tumors on the basis of gene expression.Surgery. 2005 Dec;138(6):1050-6; discussion 1056-7. doi: 10.1016/j.surg.2005.09.010. Surgery. 2005. PMID: 16360390
-
Genetic markers differentiating follicular thyroid carcinoma from benign lesions.Mol Cell Endocrinol. 2010 May 28;321(1):77-85. doi: 10.1016/j.mce.2009.11.008. Epub 2009 Nov 20. Mol Cell Endocrinol. 2010. PMID: 19932149 Review.
-
[Nodule diagnosed as follicular patterned lesion: are biomarkers the promise?].Arq Bras Endocrinol Metabol. 2007 Jul;51(5):832-42. doi: 10.1590/s0004-27302007000500022. Arq Bras Endocrinol Metabol. 2007. PMID: 17891248 Review. Portuguese.
Cited by
-
Immunohistochemical separation of follicular variant of papillary thyroid carcinoma from follicular adenoma.Endocr Pathol. 2006 Fall;17(3):213-23. doi: 10.1385/ep:17:3:213. Endocr Pathol. 2006. PMID: 17308358
-
Distinguishing molecular markers in thyroid tumors: a tribute to Dr. Orlo Clark.World J Surg. 2009 Mar;33(3):375-7. doi: 10.1007/s00268-008-9721-7. World J Surg. 2009. PMID: 18784955 No abstract available.
-
A multi-gene approach to differentiate papillary thyroid carcinoma from benign lesions: gene selection using support vector machines with bootstrapping.Endocr Relat Cancer. 2007 Sep;14(3):809-26. doi: 10.1677/ERC-06-0048. Endocr Relat Cancer. 2007. PMID: 17914110 Free PMC article.
-
Evaluation of Diagnostic Utility of the Immunohistochemical Markers in the Accurate Diagnosis of Thyroid Neoplasms: A Retrospective Study in a Tertiary Care Hospital of Pakistan.Cureus. 2022 Jan 5;14(1):e20953. doi: 10.7759/cureus.20953. eCollection 2022 Jan. Cureus. 2022. PMID: 35154933 Free PMC article.
-
A score based on microscopic criteria proposed for analysis of papillary carcinoma of the thyroid.Virchows Arch. 2008 Mar;452(3):233-40. doi: 10.1007/s00428-008-0577-x. Virchows Arch. 2008. PMID: 18239937
References
-
- What are the key statistics for thyroid cancer? [ACS web site]. Vol. 7/13/2003: American Cancer Society; 2003.
-
- U.S. Cancer Statistics Working Group. United States Cancer Statistics: 2000 Incidence. Atlanta, GA: Department of Health and Human Services, Centers for Disease Control and Prevention and National Cancer Institute; 2003.
-
- Caraway NP, Sneige N, Samaan NA. Diagnostic pitfalls in thyroid fine-needle aspiration: a review of 394 cases. Diagn Cytopathol. 1993;9:345–350. - PubMed
-
- Baloch ZW, Fleisher S, LiVolsi VA, et al. Diagnosis of “follicular neoplasm”: a gray zone in thyroid fine-needle aspiration cytology. Diagn Cytopathol. 2002;26:41–44. - PubMed
-
- Gharib H, Goellner JR. Fine-needle aspiration biopsy of the thyroid: an appraisal. Ann Intern Med. 1993;118:282–289. - PubMed
Publication types
MeSH terms
LinkOut - more resources
Full Text Sources
Other Literature Sources
Medical
Miscellaneous
