

Human replication-dependent histone H3 genes are activated by a tandemly arranged pair of two CCAAT boxes
- PMID: 15320874
- PMCID: PMC1134115
- DOI: 10.1042/BJ20040502
Human replication-dependent histone H3 genes are activated by a tandemly arranged pair of two CCAAT boxes
Abstract
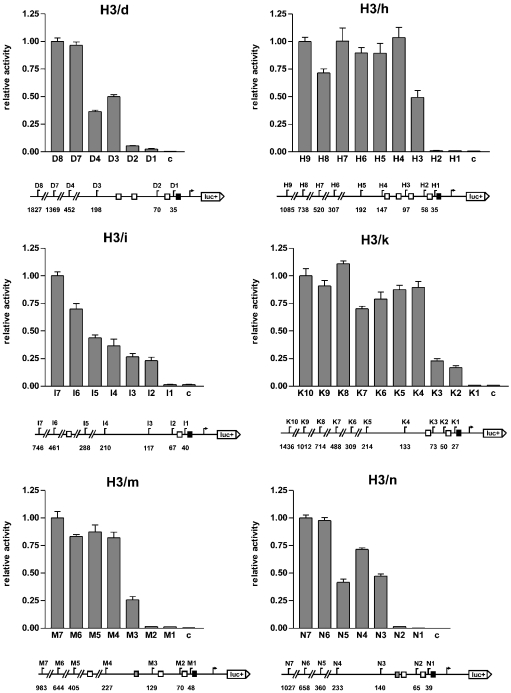
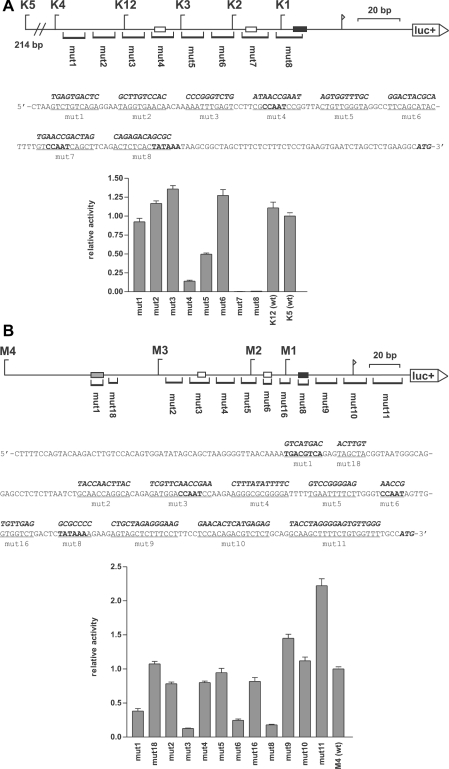
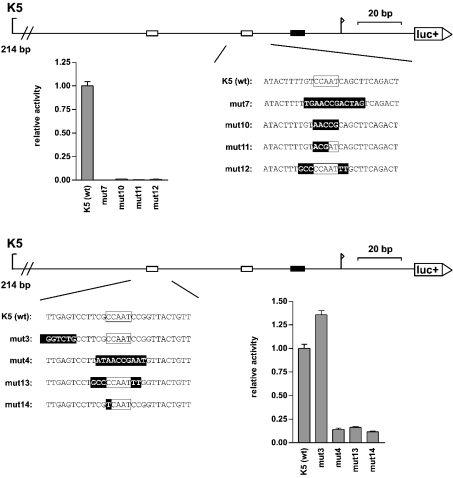
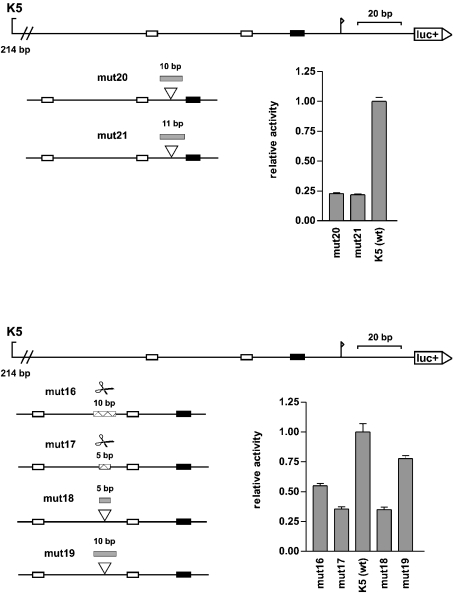
We have analysed the transcriptional regulation of the human histone H3 genes using promoter deletion series, scanning mutagenesis, specific mutagenesis and electrophoretic mobility-shift assay experiments. The promoters of five of the six examined histone H3 genes showed near-maximal activity at lengths of 133-227 bp: H3/d 198 bp, H3/h 147 bp, H3/k 133 bp, H3/m 227 bp, H3/n 140 bp (exception H3/i). To search for functional cis-elements within these regions, we performed scanning mutagenesis of the two histone H3 promoters H3/k and H3/m. Mutagenesis revealed that the functional framework of the histone H3 promoters consists of a TATA box and two tandemly arranged CCAAT boxes in relatively fixed positions. Alterations of the distance between the CCAAT boxes and of the distance between the CCAAT boxes and the TATA box resulted in significant loss of activity. In electrophoretic mobility-shift assay experiments, the factor CBF (CCAAT-binding factor)/NF-Y (nuclear factor-Y) bound to isolated CCAAT boxes of the H3/k promoter. This suggests that an initiation complex is formed on the histone H3 promoter that has a defined structure and limited flexibility, consisting of two molecules of CBF/NF-Y and further (general or specific) transcription factors.
Figures

Similar articles
-
Regulation of the gene promoter for extracellular signal-regulated protein kinase 2 by transcription factors NF-Y and Sp3.Biochem J. 2000 Apr 1;347 Pt 1(Pt 1):155-61. Biochem J. 2000. PMID: 10727414 Free PMC article.
-
Cell cycle controlled histone H1, H3, and H4 genes share unusual arrangements of recognition motifs for HiNF-D supporting a coordinate promoter binding mechanism.J Cell Physiol. 1994 Jun;159(3):515-30. doi: 10.1002/jcp.1041590316. J Cell Physiol. 1994. PMID: 8188766
-
Protein/DNA interactions involving ATF/AP1-, CCAAT-, and HiNF-D-related factors in the human H3-ST519 histone promoter: cross-competition with transcription regulatory sites in cell cycle controlled H4 and H1 histone genes.J Cell Biochem. 1991 Dec;47(4):337-51. doi: 10.1002/jcb.240470408. J Cell Biochem. 1991. PMID: 1795016
-
A survey of 178 NF-Y binding CCAAT boxes.Nucleic Acids Res. 1998 Mar 1;26(5):1135-43. doi: 10.1093/nar/26.5.1135. Nucleic Acids Res. 1998. PMID: 9469818 Free PMC article. Review.
-
The molecular biology of the CCAAT-binding factor NF-Y.Gene. 1999 Oct 18;239(1):15-27. doi: 10.1016/s0378-1119(99)00368-6. Gene. 1999. PMID: 10571030 Review.
Cited by
-
The histone gene transcription factor HiNF-P stabilizes its cell cycle regulatory co-activator p220NPAT.Biochemistry. 2006 Dec 26;45(51):15915-20. doi: 10.1021/bi061425m. Biochemistry. 2006. PMID: 17176114 Free PMC article.
-
Lipid metabolic pathways as lung cancer therapeutic targets: a computational study.Int J Mol Med. 2012 Apr;29(4):519-29. doi: 10.3892/ijmm.2011.876. Epub 2011 Dec 30. Int J Mol Med. 2012. PMID: 22211244 Free PMC article.
-
Bidirectional histone-gene promoters in Aspergillus: characterization and application for multi-gene expression.Fungal Biol Biotechnol. 2019 Dec 9;6:24. doi: 10.1186/s40694-019-0088-3. eCollection 2019. Fungal Biol Biotechnol. 2019. PMID: 31867115 Free PMC article.
-
Nuclear factor-Y (NF-Y) regulates transcription of mouse Dmrt7 gene by binding to tandem CCAAT boxes in its proximal promoter.Int J Biol Sci. 2010 Oct 25;6(7):655-64. doi: 10.7150/ijbs.6.655. Int J Biol Sci. 2010. PMID: 21060727 Free PMC article.
References
-
- Albig W., Doenecke D. The human histone gene cluster at the D6S105 locus. Hum. Genet. 1997;101:284–294. - PubMed
-
- Frank D., Doenecke D., Albig W. Differential expression of human replacement and cell cycle dependent H3 histone genes. Gene. 2003;312:135–143. - PubMed
-
- Schümperli D., Albrecht U., Koning T. W., Melin L., Soldati D., Stauber C., Luhrmann R. Biochemical studies of U7 snRNPs and of histone RNA 3′ processing. Mol. Biol. Rep. 1990;14:205–206. - PubMed
-
- Dominski Z., Marzluff W. F. Formation of the 3′ end of histone mRNA. Gene. 1999;239:1–14. - PubMed
Publication types
MeSH terms
Substances
LinkOut - more resources
Full Text Sources
Other Literature Sources
Molecular Biology Databases