. 2004 Aug 20:2:30.
doi: 10.1186/1741-7015-2-30.

Loss of KCNJ10 protein expression abolishes endocochlear potential and causes deafness in Pendred syndrome mouse model

Affiliations

Loss of KCNJ10 protein expression abolishes endocochlear potential and causes deafness in Pendred syndrome mouse model

Philine Wangemann et al. BMC Med. .

Abstract

Background: Pendred syndrome, a common autosomal-recessive disorder characterized by congenital deafness and goiter, is caused by mutations of SLC26A4, which codes for pendrin. We investigated the relationship between pendrin and deafness using mice that have (Slc26a4+/+) or lack a complete Slc26a4 gene (Slc26a4-/-).

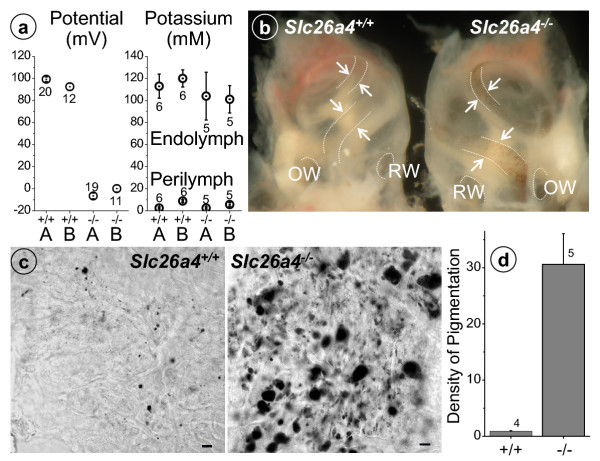
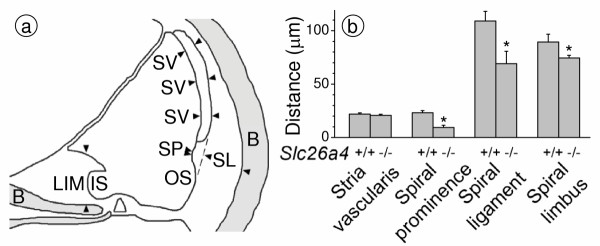
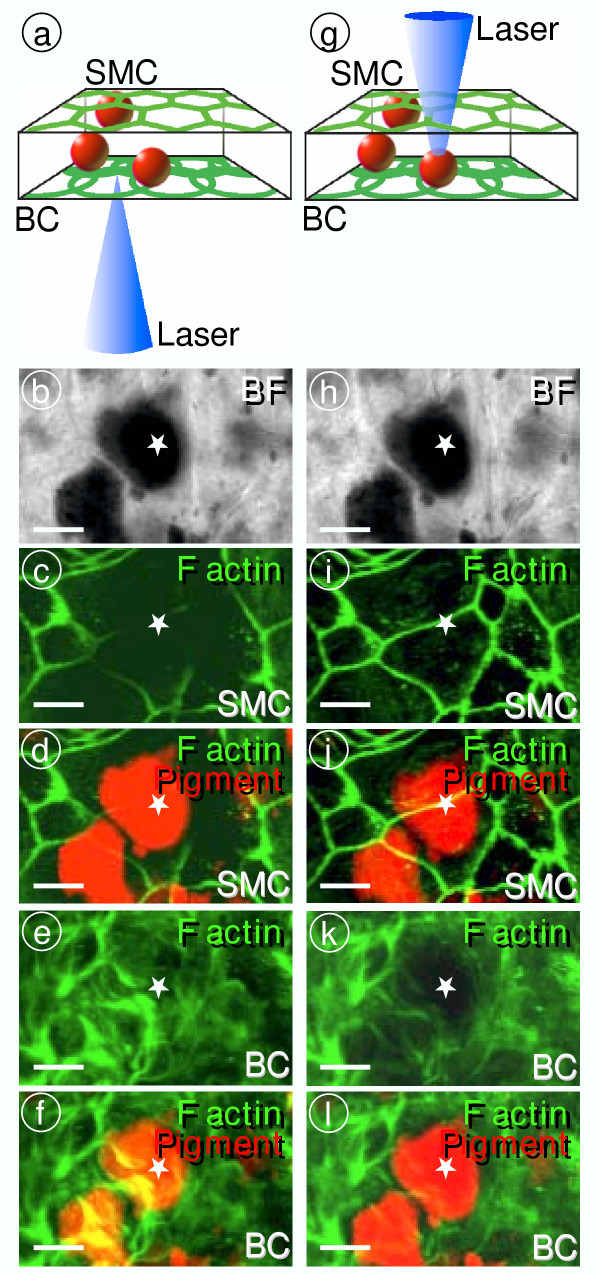
Methods: Expression of pendrin and other proteins was determined by confocal immunocytochemistry. Expression of mRNA was determined by quantitative RT-PCR. The endocochlear potential and the endolymphatic K+ concentration were measured with double-barreled microelectrodes. Currents generated by the stria marginal cells were recorded with a vibrating probe. Tissue masses were evaluated by morphometric distance measurements and pigmentation was quantified by densitometry.

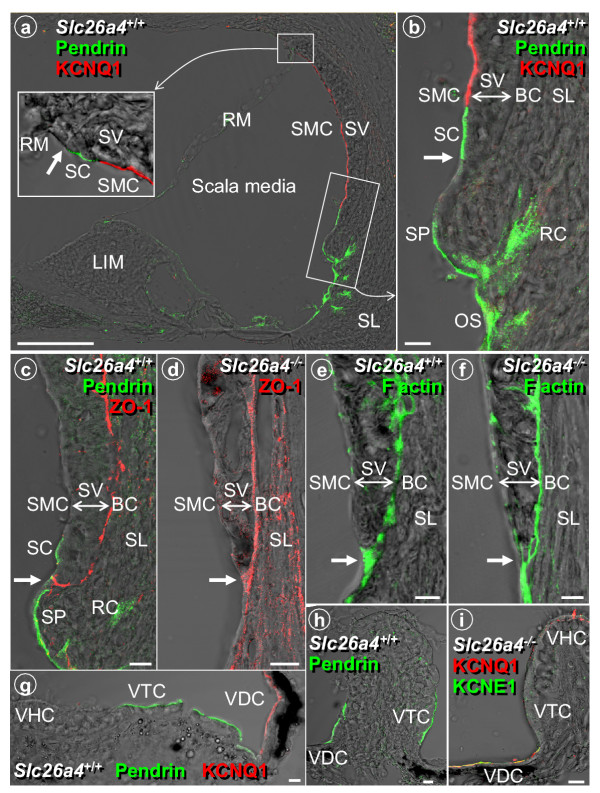
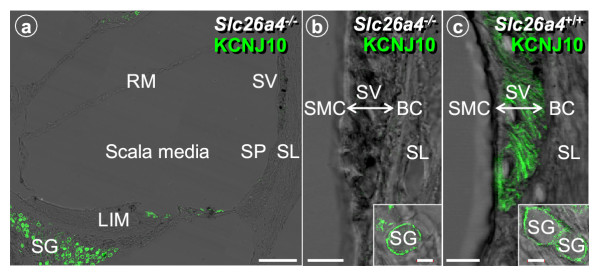
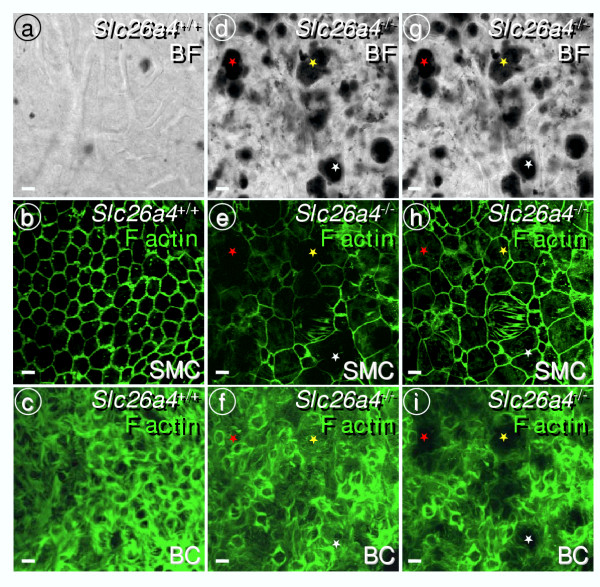
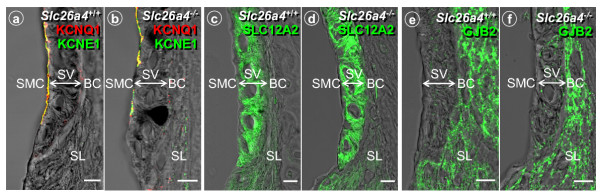
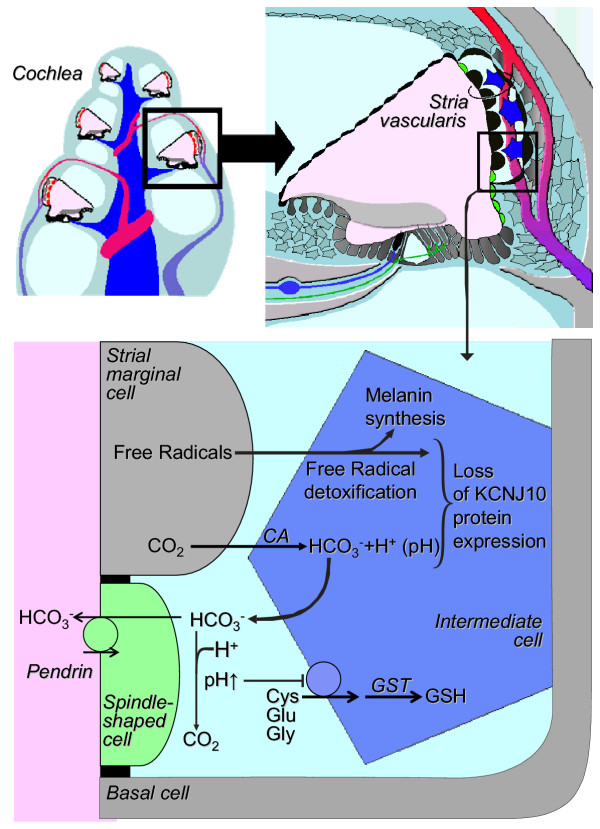
Results: Pendrin was found in the cochlea in apical membranes of spiral prominence cells and spindle-shaped cells of stria vascularis, in outer sulcus and root cells. Endolymph volume in Slc26a4-/- mice was increased and tissue masses in areas normally occupied by type I and II fibrocytes were reduced. Slc26a4-/- mice lacked the endocochlear potential, which is generated across the basal cell barrier by the K+ channel KCNJ10 localized in intermediate cells. Stria vascularis was hyperpigmented, suggesting unalleviated free radical damage. The basal cell barrier appeared intact; intermediate cells and KCNJ10 mRNA were present but KCNJ10 protein was absent. Endolymphatic K+ concentrations were normal and membrane proteins necessary for K+ secretion were present, including the K+ channel KCNQ1 and KCNE1, Na+/2Cl-/K+ cotransporter SLC12A2 and the gap junction GJB2.

Conclusions: These observations demonstrate that pendrin dysfunction leads to a loss of KCNJ10 protein expression and a loss of the endocochlear potential, which may be the direct cause of deafness in Pendred syndrome.


Figures

Figure 1
Figure 1
Protein localization of pendrin, KCNQ1, ZO-1 and F actin in cochlea and vestibular labyrinth of Slc26a4+/+ and Slc26a4-/- mice. a: Overview of cochlea; bar = 100 μm. b-f: Detail of cochlear lateral wall; bar = 10 μm. g: Detail of utricle; bar = 10 μm. h-i: Detail of ampulla; bar = 10 μm. RM, Reissner's membrane; SC, spindle-shaped cells, SMC, strial marginal cells; SV, stria vascularis; SL, spiral ligament; LIM, spiral limbus. BC, basal cells; SP, spiral prominence epithelial cells; RC, root cells; OS, outer sulcus epithelial cells; VHC, vestibular hair cells; VTC, vestibular transitional cells; VDC, vestibular dark cells; arrows, basal cells at the top and bottom of stria vascularis form tight junctions with surface epithelial cells.
Figure 2
Figure 2
Potential, K+ concentrations and pigmentation of stria vascularis in Slc26a4+/+ and Slc26a4-/- mice. a: Endocochlear potential and K+ concentrations in endolymph and perilymph at the apex (A) and base (B) of the cochlea. Numbers adjacent to symbols denote number of measurements. b-d: Pigmentation of stria vascularis in Slc26a4+/+ and Slc26a4-/- mice. b: View of stria vascularis through the bony capsule of the cochlea. OW, oval window, RW, round window; arrows, stria vascularis. c-d: Whole-mounts of stria vascularis isolated from age-matched mice. c: Laser-scanning images, bar = 10 μm, d: Quantification of pigmentation based on optical density.
Figure 3
Figure 3
Quantification of KCNJ10 and KCNQ1 mRNA expression in stria vascularis and spiral ganglia of Slc26a4+/+ and Slc26a4-/- mice. a: Electropherogram of total RNA isolated from stria vascularis microdissected from one mouse. The amount of total RNA was obtained from the total integral (shaded) and the amount of 18S rRNA was obtained from the integral of the 18S peak. Sharp peaks representing 18S and 28S rRNA demonstrate the high quality of RNA. Insert: Genotype of Slc26a4-/- mice was verified by the observation of one or few very large rhomboedric otoconia in the utricular macula (arrow). A, crista ampullaris; U, utricular macula. Scale bar: 100 μm. b: Example of real-time RT-PCR data used for quantification of 18S, KCNJ10, KCNQ1 and KCNQ4. Known quantities of 18S rRNA were used to calibrate the threshold. SV, stria vascularis; SG, spiral ganglia. c: Quantification of KCNJ10 and KCNQ1 mRNA in young Slc26a4+/+ and young and old Slc26a4-/- mice.
Figure 4
Figure 4
Protein localization of KCNJ10 in the cochlea of Slc26a4+/+ and Slc26a4-/- mice. a: Overview of cochlea; bar = 100 μm. Compare to Fig. 1a to note the enlarged scala media and the distended Reissner's membrane. b-c: Detail of lateral wall and spiral ganglia (insert); main bar: 10 μm, insert: 5 μm. Expression of KCNJ10 in Slc26a4-/- mice was absent in stria vascularis but unchanged in spiral ganglion cells. RM, Reissner's membrane, SV, stria vascularis; SP, spiral prominence; SL, spiral ligament; LIM, spiral limbus; SG, spiral ganglion.
Figure 5
Figure 5
Morphometric analysis of cochlear tissue masses in Slc26a4+/+ and Slc26a4-/- mice. a: locations of measurements. Thickness of stria vascularis (SV) was obtained as average of three distance measurements perpendicular to the surface of marginal cells. Thickness of spiral prominence (SP) was measured perpendicular to a tangential line (dashed) that connects the surface of the outer sulcus (OS) with the basal layer of stria vascularis. Thickness of spiral ligament (SL) was measured perpendicular to the tangential line as distance between the surface of spiral prominence and the interface between spiral ligament and bone (B). Thickness of spiral limbus (LIM) was obtained perpendicular to the surface of the bone as a tangential line that touches the inner sulcus (IS) and reaches from the surface of the spiral limbus to the interface between spiral limbus connective tissue and bone. b: Summary. Data from 7–8 animals contributed to each column.
Figure 6
Figure 6
Analysis of marginal and basal cell barriers by in Slc26a4-/- mice. Tight junctions were visualized by F actin. Whole-mounts of stria vascularis were viewed either from the basal cell side (a-f) or from the marginal cell side (g-l). Bright field images verify that the same area was viewed from either side (b and h). Colored bright field images were mixed with images of F actin staining to indicate the position of pigment granules (d, j, f and l). Focus was varied to either visualize the marginal cell barrier (SMC, c-d and i-j) or the basal cell barrier (BC, e-f and k-l). Both the marginal cell (e-f) and the basal cell barrier (i-f) appeared to be intact. It was critical for this finding that pigmentation did not block the path of the laser. Blockage of the laser by pigmentation produces the untrue impression of a discontinuous marginal cell barrier (c-d) or basal cell barrier (k-l). Comparison of images is aided by marking a significant area with a star. Bars = 10 μm.
Figure 7
Figure 7
Analysis of marginal and basal cell barriers in Slc26a4+/+ and Slc26a4-/- mice. Tight junctions were visualized by F actin in whole-mounts of stria vascularis. Bright field images were taken to evaluate pigmentation (a, d and g). Note the intact marginal cell (b) and basal cell (c) barriers in Slc26a4+/+ mice. Minimal pigmentation of Slc26a4+/+ mice did not compromise F actin localization. Whole-mounts of stria vascularis from Slc26a4-/- mice were viewed either from the basal cell side (e-f) or from the marginal cell side (h-i). Bright field images verify that the same area was viewed from either side (d and g). Focus was varied to either visualize the marginal cell barrier (SMC, b,e and h) or the basal cell barrier (BC, c,f and i). Both the basal cell (f) and the marginal cell (h) barriers appeared to be intact. Blockage of the laser by pigmentation produces the untrue impression of 'holes' in the marginal cell barrier (e) or basal cell barrier (i). Comparison of images is aided by marking three significant areas with colored stars. Bars = 10 μm.
Figure 8
Figure 8
Protein localization of KCNQ1, KCNE1, SLC12A2 and GJB2 in the cochlear lateral wall of Slc26a4+/+ and Slc26a4-/- mice. a-f: bars: 10 μm. SMC, strial marginal cells; SV, stria vascularis; BC, basal cells; SL, spiral ligament.
Figure 9
Figure 9
Model for the loss of KCNJ10 in the absence of pendrin expression in stria vascularis. Cys, cysteine, Glu, glutamate, Gly, glycine, CA, carbonic anhydrase, GST, glutathione-S-transferase, GSH, glutathione.

References

    1. Pendred V. Deaf-mutism and goitre. Lancet. 1896;11:532. doi: 10.1016/S0140-6736(01)74403-0. - DOI
    1. Everett LA, Glaser B, Beck JC, Idol JR, Buchs A, Heyman M, Adawi F, Hazani E, Nassir E, Baxevanis AD, Sheffield VC, Green ED. Pendred syndrome is caused by mutations in a putative sulphate transporter gene (PDS) Nat Genet. 1997;17:411–422. doi: 10.1038/ng1297-411. - DOI - PubMed
    1. Royaux IE, Suzuki K, Mori A, Katoh R, Everett LA, Kohn LD, Green ED. Pendrin, the protein encoded by the Pendred syndrome gene (PDS), is an apical porter of iodide in the thyroid and is regulated by thyroglobulin in FRTL-5 cells. Endocrinology. 2000;141:839–845. doi: 10.1210/en.141.2.839. - DOI - PubMed
    1. Bidart JM, Mian C, Lazar V, Russo D, Filetti S, Caillou B, Schlumberger M. Expression of pendrin and the Pendred syndrome (PDS) gene in human thyroid tissues. J Clin Endocrinol Metab. 2000;85:2028–2033. doi: 10.1210/jc.85.5.2028. - DOI - PubMed
    1. Reardon W, OMahoney CF, Trembath R, Jan H, Phelps PD. Enlarged vestibular aqueduct: a radiological marker of Pendred syndrome, and mutation of the PDS gene. QJM. 2000;93:99–104. doi: 10.1093/qjmed/93.2.99. - DOI - PubMed

Publication types