. 2004 Aug 31;101(35):12798-803.
doi: 10.1073/pnas.0402168101. Epub 2004 Aug 20.

Protein patterns at lipid bilayer junctions

Affiliations

Protein patterns at lipid bilayer junctions

Raghuveer Parthasarathy et al. Proc Natl Acad Sci U S A. .

Abstract

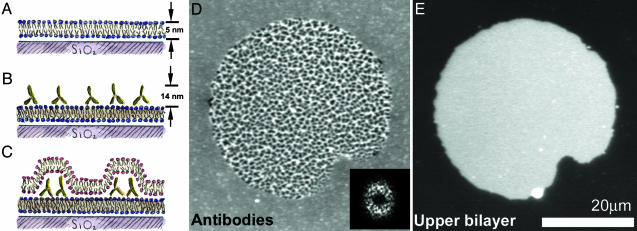
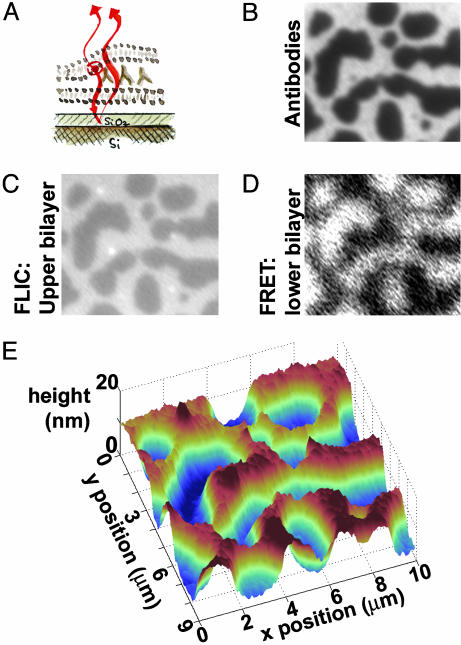
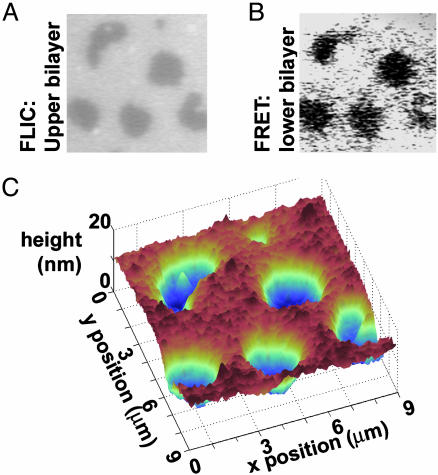
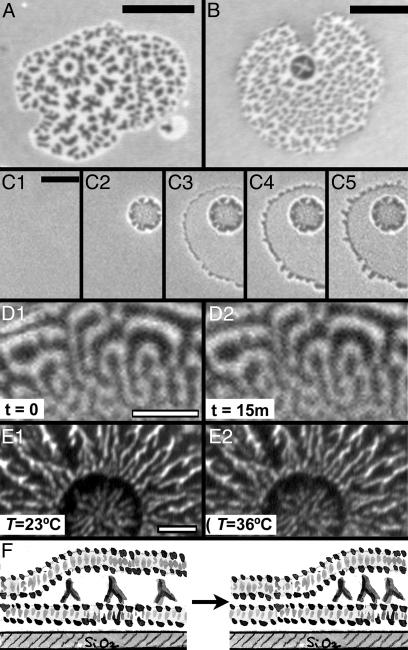
We introduce a simple intermembrane junction system in which to explore pattern and structure formation by membrane-bound proteins. The junction consists of a planar lipid bilayer to which one species of protein (an IgG antibody) is bound, forming a 2D, compressible fluid. Upon the adhesion of a second lipid bilayer, the formerly uniformly distributed proteins rapidly reorganize into patterns of dense and sparse zones. Using a combination of complementary imaging techniques (fluorescence microscopy, fluorescence interference contrast microscopy, and fluorescence resonance energy transfer), we reconstruct the 3D structure of these intermembrane patterns with nanometer-scale topographic resolution, revealing the orientation of the proteins. The patterns form as the rapid bilayer-bilayer adhesion, often radiating outward from an initial, circular contact site, pushes aside the antibodies, sweeping them into areas of high density and clearing low-density regions. Coarsening of these local features is energetically costly and therefore kinetically trapped; the patterns do not change over tens of minutes. These studies demonstrate that membrane mechanical forces alone, i.e., in the absence of specific biochemical interactions, can drive microm-scale organization of membrane proteins.


Figures

Fig. 1.
Fig. 1.
Protein patterns at lipid bilayer junctions. (A–C) Schematic (side view) of the experimental setup. (A) A supported lipid bilayer, with ≈1% biotinylated lipid, self-assembles on a glass substrate. (B) Antibiotin antibodies bind to the supported bilayer, forming a layer of fluid, membrane-bound protein. (C) Giant lipid vesicles tens of micrometers in diameter (schematic not shown) are introduced to the supported bilayer/antibody system. The giant vesicles rupture, creating a bilayer-bilayer junction. Interbilayer adhesion leads to reorganization of the proteins into dense and sparse regions. (D) Fluorescence image (top view) of FITC-labeled antibiotin; the central region, corresponding to the bilayer-bilayer junction, is patterned into zones of high and low density. The protein patterns often exhibit considerable regularity; the 2D Fourier transform (2DFT) shows a broad ring corresponding to a spatial periodicity ≈1–2 μm in wavelength. (Inset) The squared magnitude of the 2DFT. (E) Fluorescence image (top view) of the Texas red-labeled upper bilayer; its finite extent defines the area of the intermembrane junction. The system is in an aqueous solution of 3 mM NaCl.
Fig. 2.
Fig. 2.
Topographic reconstruction via FLIC microscopy and FRET. (A) Schematic illustration. The supported bilayer sits on a 60-nm SiO2 layer grown on areflective silicon substrate, allowing FLIC; interference between the excitation and emission light of the fluorophores in the upper bilayer with their reflections from the Si surface leads to height-dependent fluorescence intensity. Images B–D are 10 μm wide. (B) Fluorescence image of FITC-labeled antibodies at an intermembrane junction, as in Fig. 1D.(C) Fluorescence image of the Texas red-labeled upper bilayer. Higher intensity corresponds to greater distance from the reflective Si surface. (D) Fluorescence image of the Marina blue-labeled supported bilayer. FRET between the Marina blue donors and the Texas red and FITC acceptors diminishes the blue fluorescence, with the protein/bilayer FRET dominating. Hence, areas of sparse antibodies, where there is no FITC/Marina blue FRET, appear brighter than dense areas. (E) Topographic reconstruction from the FLIC data of C, showing the upper bilayer patch draped over hills and valleys of antibodies ≈14 nm in height. The system is in an aqueous solution of 10 mM NaCl.
Fig. 3.
Fig. 3.
Reconstruction of the intermembrane structure using FLIC microscopy and FRET, with unlabeled proteins. As in Fig. 2, the supported bilayer sits on a 60-nm SiO2/Si substrate. Images A and B are 9 μm wide. (A) Fluorescence image of the Texas red-labeled upper bilayer. Higher intensity corresponds to greater distance from the Si surface. (B) Fluorescence intensity of the Marina blue-labeled supported bilayer. Energy transfer between the Marina blue donors and the Texas red acceptors is the only FRET mode possible. Hence, areas of sparse antibodies, where the upper and lower bilayers are in tight contact, appear darker than dense areas, in contrast to Fig. 2. (C) Topographic reconstruction from the FLIC data of A, showing the upper bilayer patch draped over hills and valleys of antibodies ≈14 nm in height. The system is in an aqueous solution of 5 mM NaCl.
Fig. 4.
Fig. 4.
Dynamics of intermembrane protein patterns. Images A–E are fluorescence images of FITC-labeled antibodies. (A and B) Patterns that include a nearly radially symmetric feature. (Bar = 10 μm.) (C) Images taken during the formation of an intermembrane junction. Initially (C1, time t = 0), the antibodies are uniformly distributed along the supported bilayer. A giant vesicle approaches, redistributing the proteins at a circular contact zone (C2, t = 0.44 s); the vesicle then ruptures, forming a larger intermembrane junction (C3, t = 0.88 s). At the junction edges, fingering of the spreading upper bilayer patch pushes antibodies outward (C3, t = 0.88 s; C4, t = 1.32 s); the spreading slows and soon stops (C5, t = 7.48 s). Fine patterns in the junction area are not visible at the low resolution and short exposure times at which this sequence was taken. (Bar = 5 μm.) (D) After their formation, the protein distribution is static and does not coarsen with time; shown are images of the same region, separated in time by 15 min. (Bar = 3 μm.) (E) Heating the intermembrane junctions from room temperature (23°C) to 40°C leaves the protein patterns unaffected; shown are images of the same junction, formed at 23°C, taken at 23°C and 36°C. (F) Schematic illustration: the strong bilayer-bilayer adhesion energy pushes antibodies into dense zones to maximize the area of tight bilayer-bilayer contact.
Fig. 5.
Fig. 5.
The area fraction occupied by dense protein regions (φd) increases as a function of the initial (uniform) protein density. Data were collected from three series of samples. Solid lines are linear fits, as discussed in the text. Despite the large amount of variability in the patterns, a similar upward trend is evident in each of the data sets.

References

    1. Dustin, M. L. & Colman, D. R. (2002) Science 29, 785–789. - PubMed
    1. Monks, C. R. F., Freiberg, B. A., Kupfer, H., Sciaky, N. & Kupfer, A. (1998) Nature 395, 82–86. - PubMed
    1. Grakoui, A., Bromley, S. K., Sumen, C., Davis, M. M., Shaw, A. S., Allen, P. M. & Dustin, M. L. (1999) Science 285, 221–227. - PubMed
    1. Lee, K.-H., Dinner, A. R., Tu, C., Campi, G., Raychaudhuri, S., Varma, R., Sims, T. N., Burack, W. R., Wu, H., Wang, J., et al. (2003) Science 302, 1218–1222. - PubMed
    1. Igakura, T., Stinchcombe, J. C., Goon, P. K. C, Taylor, G. P., Weber, J. N., Griffiths, G. M., Tanaka, Y., Osame, M. & Bangham, C. R. M. (2003) Science 299, 1713–1716. - PubMed

Publication types

MeSH terms

LinkOut - more resources