

Activities and sensitivities in boolean network models
- PMID: 15323803
- PMCID: PMC1490311
- DOI: 10.1103/PhysRevLett.93.048701
Activities and sensitivities in boolean network models
Abstract
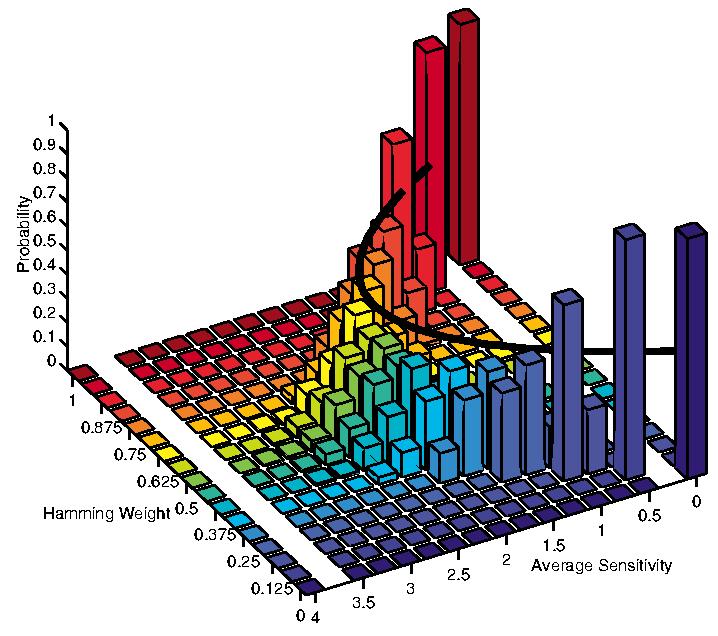
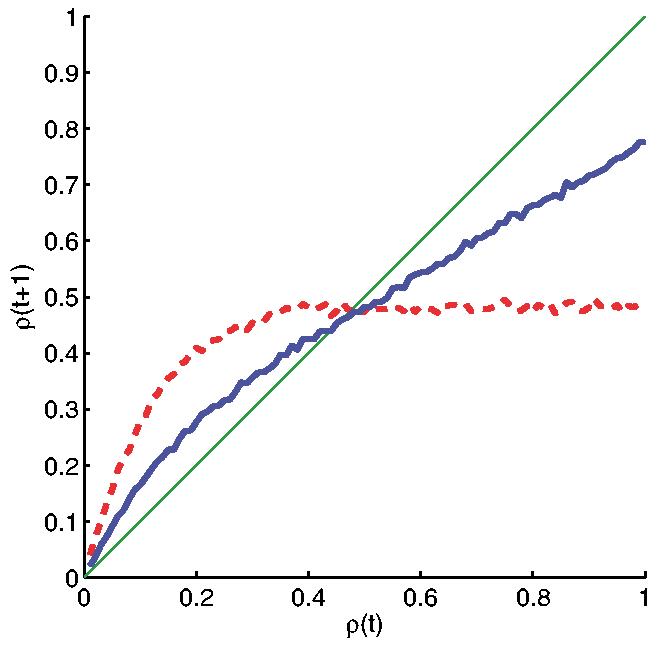
We study how the notions of importance of variables in Boolean functions as well as the sensitivities of the functions to changes in these variables impact the dynamical behavior of Boolean networks. The activity of a variable captures its influence on the output of the function and is a measure of that variable's importance. The average sensitivity of a Boolean function captures the smoothness of the function and is related to its internal homogeneity. In a random Boolean network, we show that the expected average sensitivity determines the well-known critical transition curve. We also discuss canalizing functions and the fact that the canalizing variables enjoy higher importance, as measured by their activities, than the noncanalizing variables. Finally, we demonstrate the important role of the average sensitivity in determining the dynamical behavior of a Boolean network.
Copyright 2004 The American Physical Society
Figures
References
-
- Kauffman SA. J. Theor. Biol. 1969;22:437. - PubMed
-
- Kauffman SA. The Origins of Order: Self-Organization and Selection in Evolution. Oxford University Press; New York: 1993.
-
- Aldana M, Coppersmith S, Kadanoff LP. In: Perspectives and Problems in Nonlinear Science. Kaplan E, Marsden JE, Sreenivasan KR, editors. Springer; New York: 2002. pp. 23–89.
-
- Fox JJ, Hill CC. Chaos. 2001;11:809. - PubMed
Publication types
MeSH terms
Grants and funding
LinkOut - more resources
Full Text Sources
Other Literature Sources