. 2004 Aug 30;166(5):661-72.
doi: 10.1083/jcb.200402136. Epub 2004 Aug 23.

Calcium-dependent regulation of the cell cycle via a novel MAPK--NF-kappaB pathway in Swiss 3T3 cells

Affiliations

Calcium-dependent regulation of the cell cycle via a novel MAPK--NF-kappaB pathway in Swiss 3T3 cells

Violaine Sée et al. J Cell Biol. .

Abstract

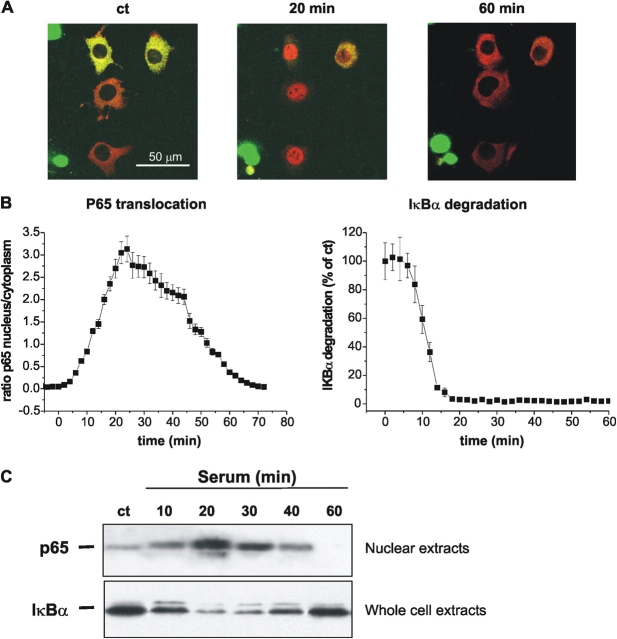
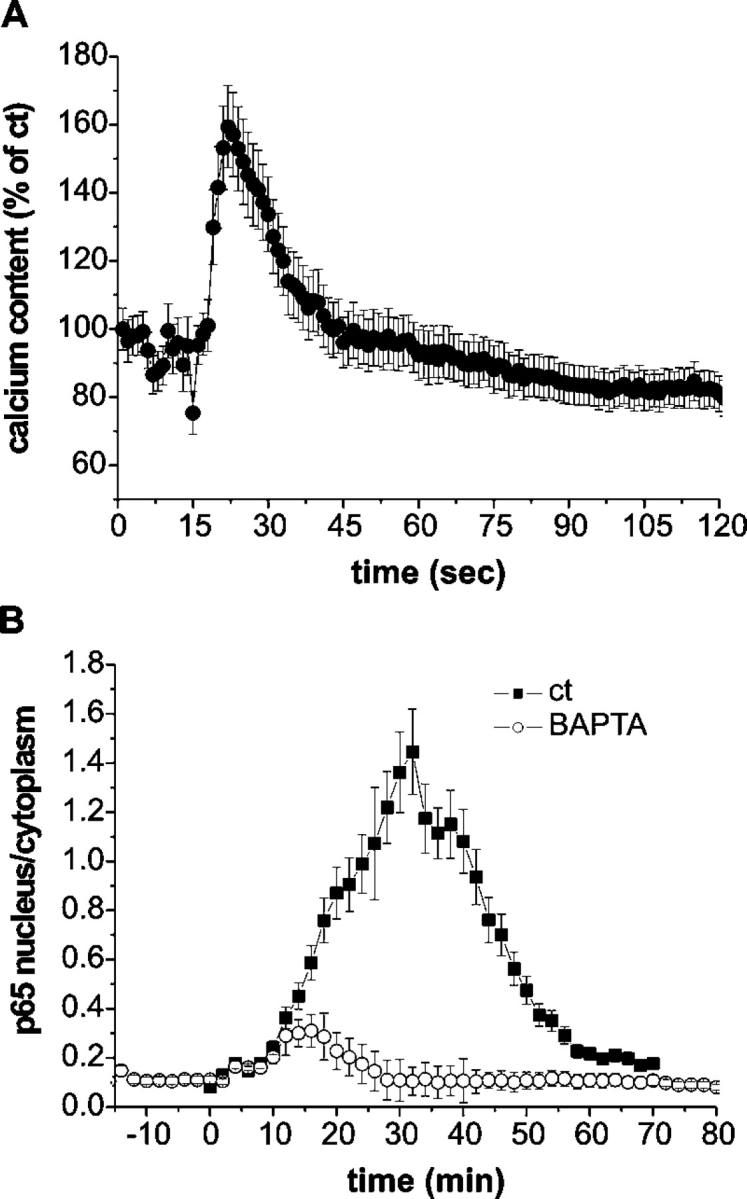
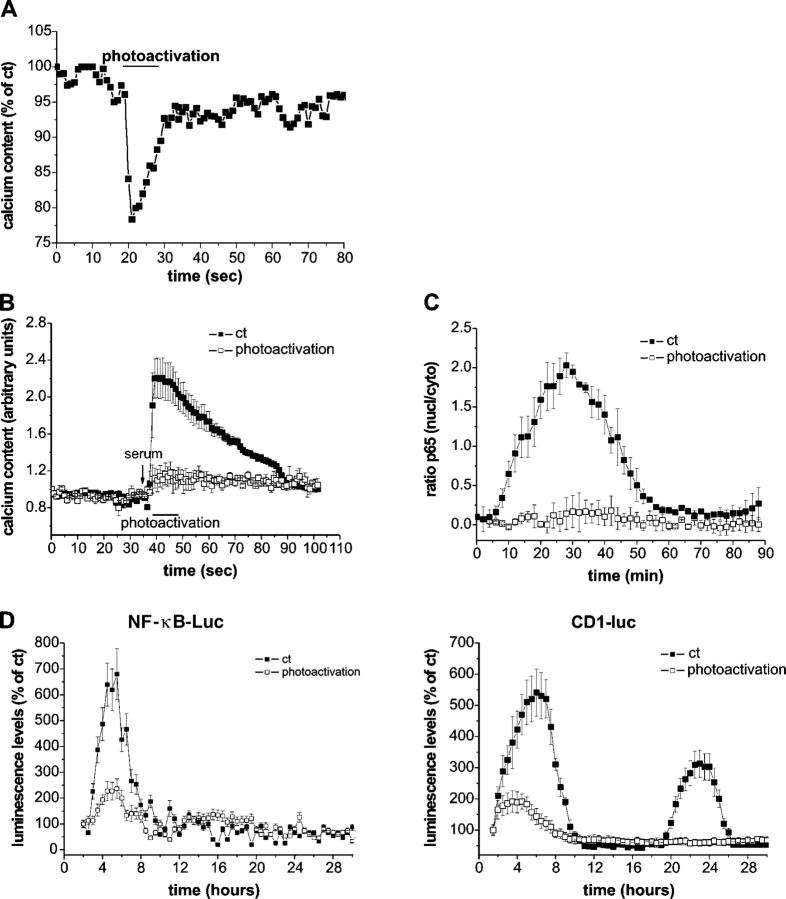
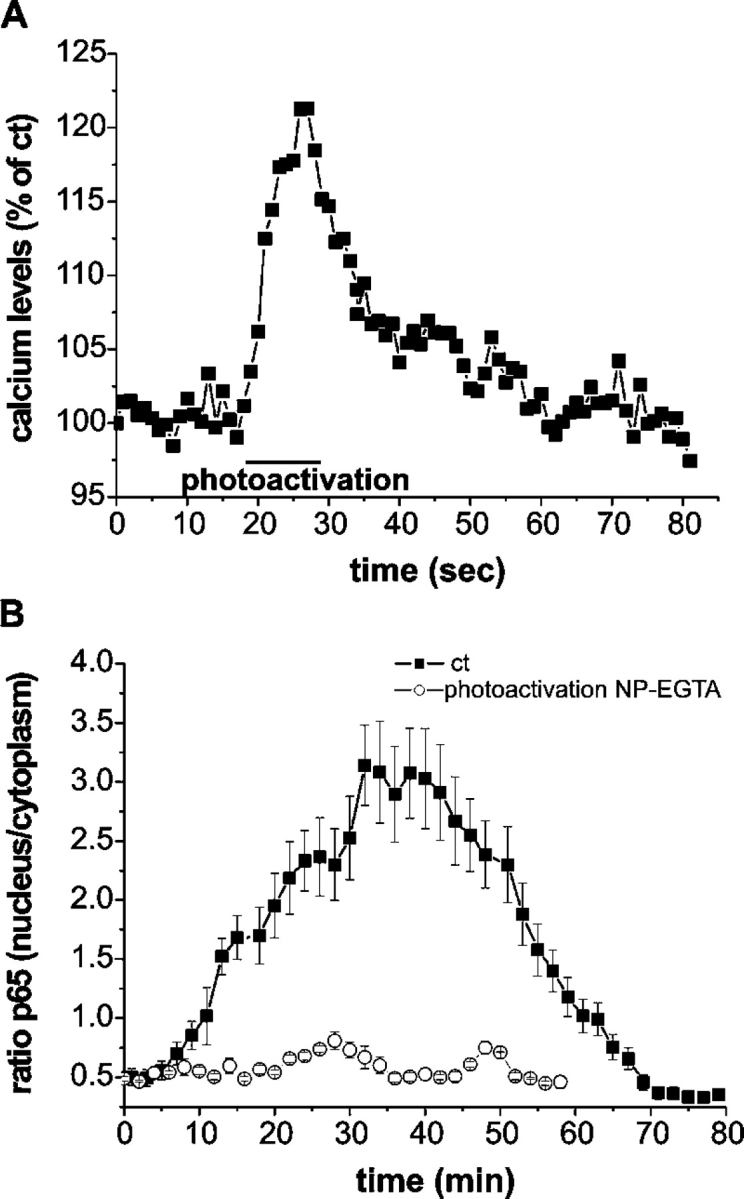
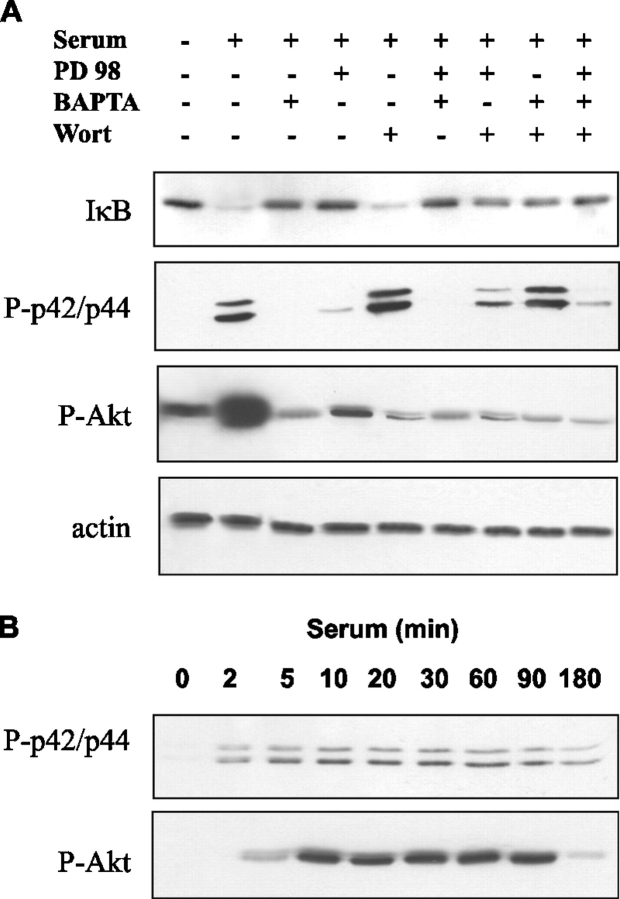
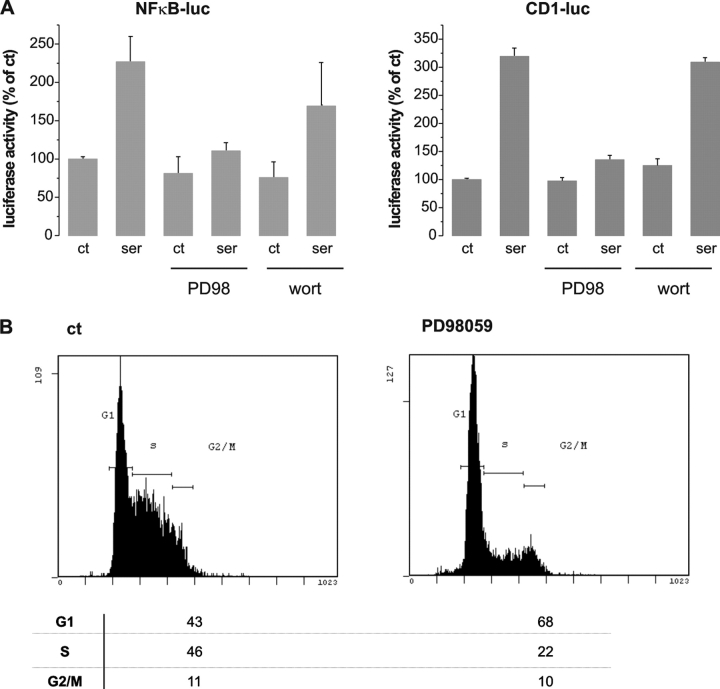
Nuclear factor kappa B (NF-kappaB) has been implicated in the regulation of cell proliferation and transformation. We investigated the role of the serum-induced intracellular calcium increase in the NF-kappaB--dependent cell cycle progression in Swiss 3T3 fibroblasts. Noninvasive photoactivation of a calcium chelator (Diazo-2) was used to specifically disrupt the transient rise in calcium induced by serum stimulation of starved Swiss 3T3 cells. The serum-induced intracellular calcium peak was essential for subsequent NF-kappaB activation (measured by real-time imaging of the dynamic p65 and IkappaBalpha fluorescent fusion proteins), cyclin D1 (CD1) promoter-directed transcription (measured by real-time luminescence imaging of CD1 promoter-directed firefly luciferase activity), and progression to cell division. We further showed that the serum-induced mitogen-activated protein kinase (MAPK) phosphorylation is calcium dependent. Inhibition of the MAPK- but not the PtdIns3K-dependent pathway inhibited NF-kappaB signaling, and further, CD1 transcription and cell cycle progression. These data suggest that a serum-dependent calcium signal regulates the cell cycle via a MAPK--NF-kappaB pathway in Swiss 3T3 cells.


Figures

Figure 1.
Figure 1.
NF-κB dependent transcription is essential for cell cycle progression. (A) Swiss 3T3 fibroblasts were serum starved for 24 h. They were then stimulated with 10% FCS for 18 h in the absence or presence of an NF-κB inhibitor (5 μM Bay117082). Cell cycle stage was determined by flow cytometry analysis of propidium iodide–stained cells. (B) Swiss 3T3 cells were transfected with the indicated reporter vectors (NF-κB luc and −1745 CD1-luc). 24 h after serum starvation, firefly luciferin (Biosynth) was added to the medium (0.5-mM final concentration). 2 h later, serum stimulation was performed and luminescence imaging was carried out using a Hamamatsu 4880-65 liquid nitrogen–cooled CCD camera. Images were acquired using 30-min integration times. (C) RT-PCR analysis was performed using primers specific to CD1 or cyclophilin A (control), with total RNA prepared from cells stimulated with 10% FCS at indicated time points. (D) RT-PCR analysis, with total RNA prepared from nonstimulated starved cells (ct) or cells stimulated 8 h with 10% FCS in the presence or absence of Bay117082.
Figure 2.
Figure 2.
The induction of CD1 promoter activity by serum is NF-κB dependent. (A) Cells were transfected with the CD1 reporter vector. After a period of 24 h of serum starvation, cells were stimulated or not (ct) with 10% FCS in the absence (ct) or presence of an NF-κB inhibitor (5 μM Bay117082; 20 min preincubation), or were cotransfected with a truncated active mutant of IκBα. (B) Cells were cotransfected with the CD1 reporter vector and either a control empty vector, or a vector expressing either transdominant-negative IKKα or IKKβ. (C) Schematic diagrams of the several CD1-luciferase reporters used. (D) Cells were transfected with the indicated reporters. (A, B, and D) Results are expressed as fold activation relative to the level measured in nonstimulated starved cells. Cells were assayed for luciferase activity 6 h after serum stimulation. Histograms are means ± SEM of triplicate values. Each experiment was performed three times. **, (P < 0.05) indicates statistically significant difference (two-tailed t test).
Figure 3.
Figure 3.
Serum stimulation promotes p65 translocation into the nucleus as well as IκBα degradation. (A) p65-dsRed (red staining) and IκBα-EGFP (green staining) were cotransfected into Swiss 3T3 fibroblasts. 24 h after serum starvation, the cells were stimulated with 10% FCS. Confocal images were collected every 2 min from transfected living cells cultured in a humidified CO2 incubator (5% CO2, 37°C) (Video 1, available at http://www.jcb.org/cgi/content/full/jcb.200402136/DC1). (B) Mean fluorescence intensities were measured for each time point in both the nucleus and cytoplasm for p65-dsRed, and the results are shown as a ratio. The IκBα-EGFP mean fluorescence intensities were measured at each time point in the cytoplasm alone and the results presented as the relative intensity to the starting fluorescence levels. Experiments were performed at least four times, with four fields. In each field there were typically 3–4 transfected cells. (C) Endogenous p65 levels in the nucleus were assessed after 10% FCS stimulation for the indicated time by Western blotting nuclear extracts using an anti-p65 antibody (1:1,000). Endogenous IκBα was assessed in whole-cell extracts using an anti-IκBα antibody (1:1,000).
Figure 4.
Figure 4.
Serum-induced p65 translocation into the nucleus is [Ca2 + ]i dependent. (A) Starved cells were loaded with 1 μM Fluo-4-AM for 20 min at 37°C and intracellular calcium changes were recorded using laser scanning confocal microscopy (488-nm excitation, 505–550-nm emission) in response to serum. Images were taken every second for 2 min, and the increase of fluorescence was calculated taking level in the control unstimulated cells as 100%. (B) Swiss 3T3 cells were transfected with p65-dsRed. Confocal images were obtained and analyzed as described above. 24 h after serum starvation, the cells were either stimulated with serum alone (filled squares) or pretreated for 10 min with 10 μM BAPTA-AM (open circles). Experiments were performed at least four times, with four fields. In each field there were typically 3–4 transfected cells.
Figure 5.
Figure 5.
The serum-induced [Ca 2+ ] i peak is essential for NF-κB–dependent signaling. (A) Starved cells were loaded with both 0.6 μM Diazo-2 and 0.6 μM Fluo-4 for 20 min at 37°C. For uncaging Diazo-2, cells were illuminated for 10 s with a Micro-point photoactivation system (Photonic Instruments). Intracellular calcium content was monitored every second by confocal microscopy (488-nm excitation, 505–550-nm emission) of Fluo-4 fluorescence. (B–D) Swiss 3T3 cells were plated on a marked dish and transfected with 0.5 μg p65-dsRed and 1.5 μg of the reporter NF-κB–luc. After 24 h of serum starvation, the cells were loaded with both Fluo-4 and Diazo-2 as previously described. After one wash, the cells were stimulated with 10% FCS. 1 s later the cells were either illuminated for 10 s (open squares) or untreated (ct, filled squares). (B) Confocal microscopy was used as previously described to measure calcium content every second for 2 min. (C) p65 localization was assessed every 2 min for 90 min as already described. (D) An intensified CCD camera (VIM; Hamamatsu Corporation) was used to assess the luminescence from fields of individual control or photoactivated cells as previously described. Experiments were performed at least four times, with four fields. In each field there were typically 3–4 transfected cells. The horizontal line in A and B marks the period of photoactivation.
Figure 6.
Figure 6.
A photoactivated induced [Ca 2+ ] i peak is not sufficient to promote p65 translocation. (A) Starved cells were loaded with both 0.6 μM NP-EGTA and 0.6 μM Fluo-4 for 20 min at 37°C. For uncaging of NP-EGTA, cells were illuminated for 10 s with a Micro-point photoactivation system (Photonic Instruments). Intracellular calcium content was monitored every second by confocal microscopy (488-nm excitation, 505–550-nm emission) of Fluo-4 fluorescence. (B) Subsequently, p65 localization was assessed every 2 min for 90 min as already described. The control (ct) is nonilluminated cells stimulated with serum. Experiments were performed at least four times, with four fields. In each field there were typically 3–4 transfected cells. The horizontal line in A and B marks the period of photoactivation.
Figure 7.
Figure 7.
IκBα degradation is both [Ca2 + ]i and p42/p44MAPK activity dependent. (A) IκBα degradation, p42/p44MAPK phosphorylation, and Akt phosphorylation were determined by Western blotting after 10 min of serum stimulation, using antibodies directed against IκBα (1:1,000), phospho-p42/p44 MAPK (Thr185/202/Tyr185/204; 1:5,000), and phospho-Akt (Ser 473; 1:5,000) and actin (1:10,000). Swiss 3T3 fibroblasts were serum starved for 24 h before serum stimulation, and the pharmacological inhibitors were added, where indicated, 20 min before the serum stimulation at the following concentrations: PD98059, 50 μM; BAPTA-AM, 10 μM; wortmannin, 100 nM. (B) The kinetics of p42/p44MAPK and Akt activation were determined by Western blotting using anti-phospho-p42/p44 MAPK and anti-phospho-Akt antibodies. 24-h serum-starved 3T3 cells were stimulated by 10% FCS for indicated time points before cell lysis.
Figure 8.
Figure 8.
p42/p44MAPK activation is determinant for CD1 transcription and further cell cycle progression. (A) Swiss 3T3 cells were transfected with the indicated reporter vectors (NF-κB luc and −1745 CD1-luc). 24 h after serum starvation, cells were stimulated or not (ct) with 10% FCS in the absence or presence of MAPK inhibitor (PD98059, 50 μM; 20-min preincubation) or Akt inhibitor (100 nM wortmannin, 20-min preincubation) as indicated. 6 h after serum stimulation, in vitro luciferase activity was measured. Histograms are means ± SEM of triplicate values. Each experiment was performed three times. (B) Swiss 3T3 fibroblasts were serum starved for 24 h. 24 h after serum starvation, the cells were stimulated with 10% FCS for 18 h in the absence (ct) or presence of PD98059 (50 μM, 20-min preincubation). Cell cycle stage was determined by flow cytometric DNA histogram analysis of propidium iodide–stained cells.

Similar articles

Cited by

References

    1. Albanese, C., J. Johnson, G. Watanabe, N. Eklund, D. Vu, A. Arnold, and R.G. Pestell. 1995. Transforming p21ras mutants and c-Ets-2 activate the cyclin D1 promoter through distinguishable regions. J. Biol. Chem. 270:23589–23597. - PubMed
    1. Albanese, C., K. Wu, M. D'Amico, C. Jarrett, D. Joyce, J. Hughes, J. Hulit, T. Sakamaki, M. Fu, A. Ben-Ze'ev, et al. 2003. IKKα regulates mitogenic signaling through transcriptional induction of cyclin D1 via Tcf. Mol. Biol. Cell. 14:585–599. - PMC - PubMed
    1. Antonsson, A., K. Hughes, S. Edin, and T. Grundstrom. 2003. Regulation of c-Rel nuclear localization by binding of Ca2+/calmodulin. Mol. Cell. Biol. 23:1418–1427. - PMC - PubMed
    1. Baeuerle, P.A., and D. Baltimore. 1996. NF-κB: ten years after. Cell. 87:13–20. - PubMed
    1. Baldwin, A.S., Jr. 1996. The NF-κB and IκB proteins: new discoveries and insights. Annu. Rev. Immunol. 14:649–683. - PubMed

Publication types

MeSH terms