. 2004 Aug 31;101(35):13086-90.
doi: 10.1073/pnas.0305329101. Epub 2004 Aug 23.

The time course of visual information accrual guiding eye movement decisions

Collaborators, Affiliations

The time course of visual information accrual guiding eye movement decisions

Avi Caspi et al. Proc Natl Acad Sci U S A. .

Abstract

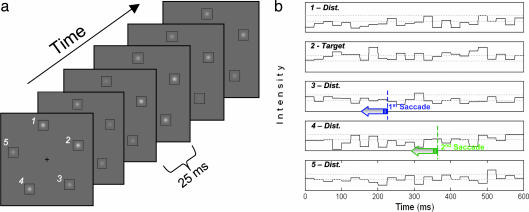
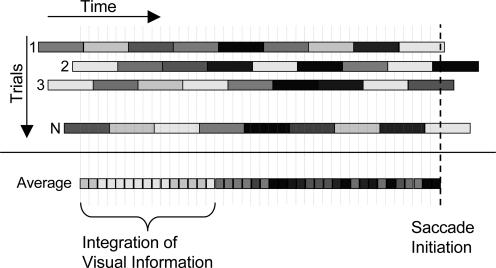
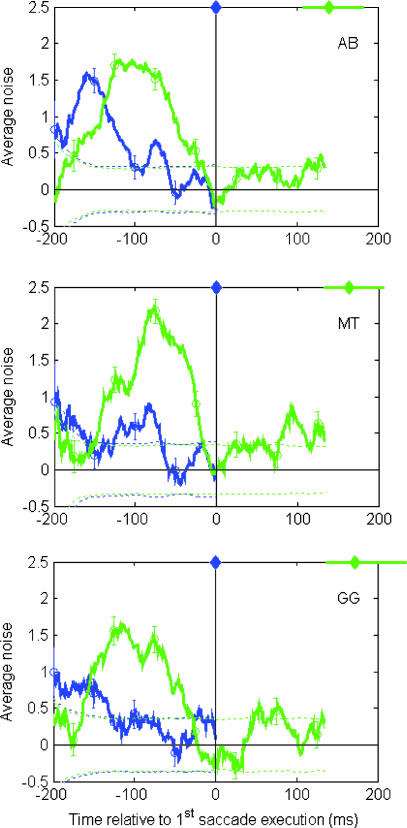
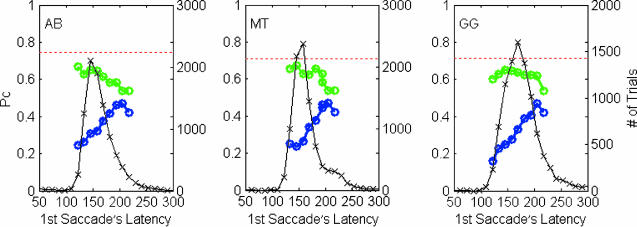
Saccadic eye movements are the result of neural decisions about where to move the eyes. These decisions are based on visual information accumulated before the saccade; however, during an approximately 100-ms interval immediately before the initiation of an eye movement, new visual information cannot influence the decision. Does the brain simply ignore information presented during this brief interval or is the information used for the subsequent saccade? Our study examines how and when the brain integrates visual information through time to drive saccades during visual search. We introduce a new technique, saccade-contingent reverse correlation, that measures the time course of visual information accrual driving the first and second saccades. Observers searched for a contrast-defined target among distractors. Independent contrast noise was added to the target and distractors every 25 ms. Only noise presented in the time interval in which the brain accumulates information will influence the saccadic decisions. Therefore, we can retrieve the time course of saccadic information accrual by averaging the time course of the noise, aligned to saccade initiation, across all trials with saccades to distractors. Results show that before the first saccade, visual information is being accumulated simultaneously for the first and second saccades. Furthermore, information presented immediately before the first saccade is not used in making the first saccadic decision but instead is stored and used by the neural processes driving the second saccade.


Figures

Fig. 1.
Fig. 1.
Dynamic search task. (a) The stimulus consists of a target and four distractors. In this example, the target was at the location marked by the number 2. On average the target was brighter than the distractors, but on each 40-Hz frame the intensities of the target and each of the distractors were chosen from independent normal distributions. (b) The intensities at the target and the distractor locations were recorded as a function of time along with eye positions. The dashed horizontal lines show the average intensities for the target and distractors. On some individual frames the intensity of a distractor is higher than that of the target because of the random noise. Such frames may lead the observer to make a saccade toward a distractor, but only if they are presented during the temporal window in which visual information is accumulated to guide the saccade.
Fig. 2.
Fig. 2.
Computation of temporal classification plots. The illustration shows the way noise samples are analyzed to obtain the classification plots. The gray level of each rectangle represents the noise value on a single frame (25 ms). A row describes an individual trial and shows the noise values as a function of time at the distractor location incorrectly chosen by the saccade. The time course of noise values across trials is aligned with respect to saccade initiation, such that time equal to zero corresponds to saccade initiation on each trial, which is indicated by the vertical bold dashed line. The classification plots were obtained by averaging the noise values for each time interval (5-ms bins) over all incorrect trials for an observer. The different time windows are marked by the vertical gray dotted lines. Average noise values at each time window bedore the saccade initiation are represented by the gray level of the rectangles of the lower line. The average noise intensity is close to zero (darker) at times when the stimulus information had no effect on the saccade's endpoint, but it is significantly larger than zero (lighter) at times when the visual information influenced the saccade's endpoint.
Fig. 3.
Fig. 3.
Classification plots based on the incorrect trials out of 10,000 trials per observer. The first and second saccade classification plots are shown by the blue and green lines, respectively. The y axis shows the average noise values at the distractor to which the saccade was directed (incorrect saccadic decision) and is plotted in gray level units (1 gray level is 0.214 cd/m2). Error bars show the standard error. The dashed lines bracket the average noise values that are not statistically different from zero with a confidence level of 95% (t tests). Both plots were computed relative to the first saccade's initiation, which is shown as time equal to zero (indicated by the blue diamond). Times before the first saccade are shown as negative values and times after the first saccade are shown as positive values. The green diamond at the top of each chart indicates the median intersaccadic interval, and the horizontal green line extends from the 20th to the 80th percentile. Initially the first saccade's integration window is high and then it decreases and approaches zero during a dead time before the first saccade's initiation. The second saccade's integration window begins low but then increases and extends throughout the first saccade's dead time.
Fig. 4.
Fig. 4.
Percent correct of the first and second saccade as a function of the first saccade's latency, shown by the blue and green lines, respectively. The data are presented in time bins of 12 ms. Values of percent correct (left axis) were calculated only for time bins with >150 trials. The number of trials in each time bin is shown by the black line (right axis). For reference, a red dashed line shows the percent correct of the perceptual decision.

References

    1. Wurtz, R. H. & Goldberg, M. E. (1971) Science 171, 82-84. - PubMed
    1. Mays, L. E. & Sparks, D. L. (1980) J. Neurophysiol. 43, 207-232. - PubMed
    1. Goldberg, M. E. & Bruce, C. J. (1990) J. Neurophysiol. 64, 489-508. - PubMed
    1. Hanes, D. P. & Schall, J. D. (1996) Science 274, 427-430. - PubMed
    1. Becker, W. (1991) in Eye Movements, ed. Carpenter, R. H. S. (Macmillan, New York), p. 117.

Publication types

LinkOut - more resources