. 2004 Aug 24;32(15):4550-62.
doi: 10.1093/nar/gkh792. Print 2004.

Redefining the structure of the mouse connexin43 gene: selective promoter usage and alternative splicing mechanisms yield transcripts with different translational efficiencies

Affiliations

Redefining the structure of the mouse connexin43 gene: selective promoter usage and alternative splicing mechanisms yield transcripts with different translational efficiencies

Ingrid Pfeifer et al. Nucleic Acids Res. .

Abstract

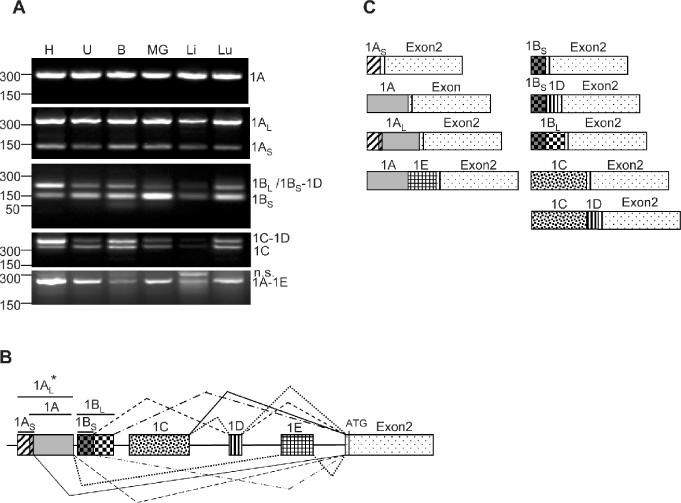
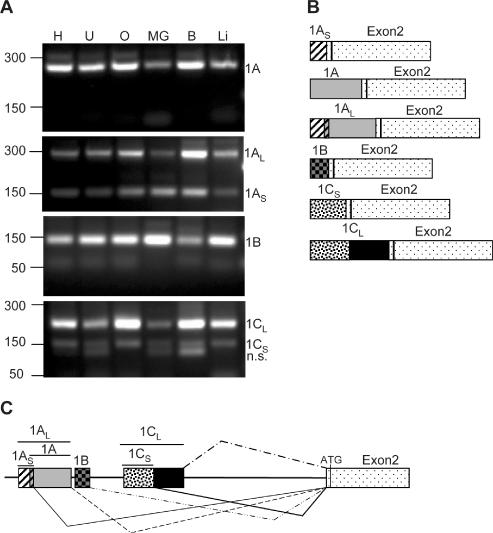
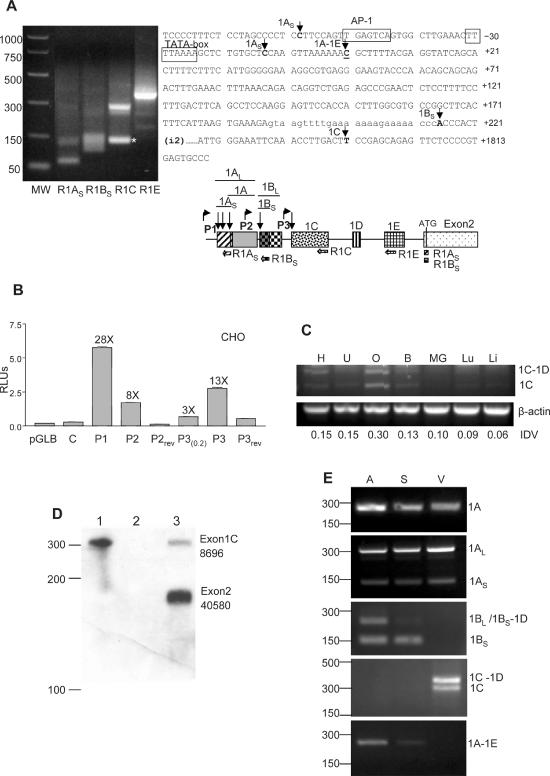
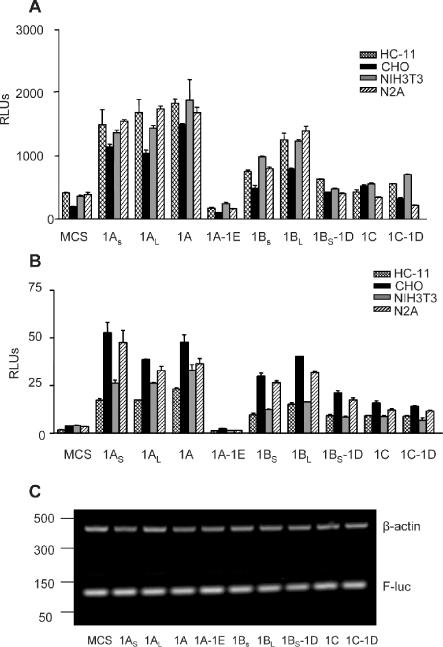
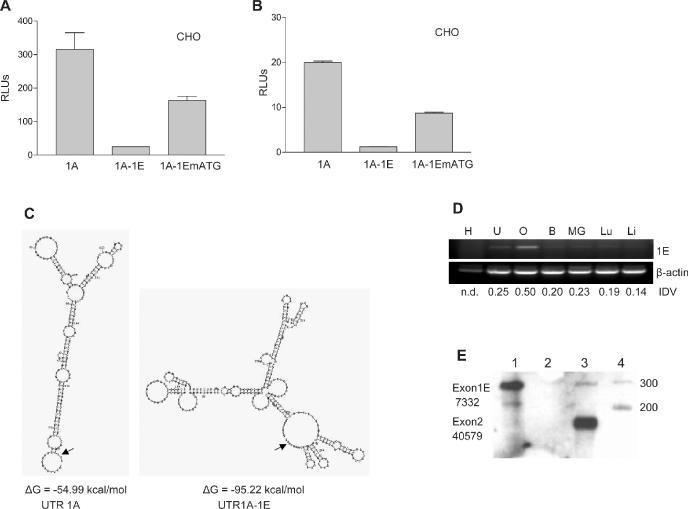
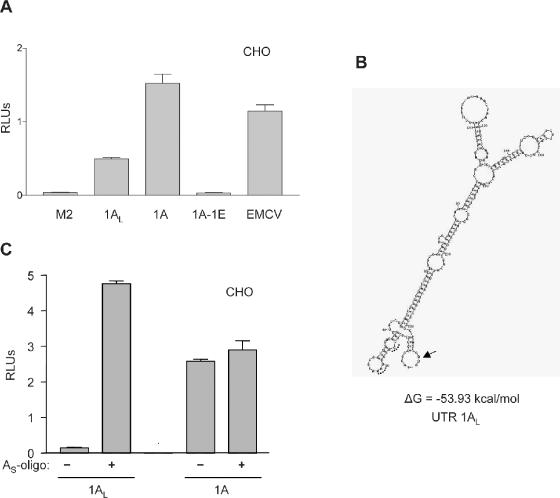
The connexin43 (cx43) gene was originally described as consisting of two exons, one coding for most of the 5'-untranslated region (5'-UTR), and the other for the protein sequence and 3'-UTR. We now report that in mouse four additional exons are expressed, all coding for novel 5'-UTRs. Altogether, we found nine different cx43 mRNA species (GenBank accession numbers NM010288, and AY427554 through AY427561) generated by differential promoter usage and alternative splicing mechanisms. The relative abundance of these different mRNAs varied with the tissue source. In addition, the different transcripts showed varying translational efficiencies in several cell lines, indicating the presence of cis-RNA elements that regulate cx43 translation. We propose that it is the promoter driving the expression of the cx43 gene that determines exon choice in the downstream splicing events in a cell-type-dependent fashion. This in turn will affect the translation efficiency of the transcript orchestrating the events that lead to the final expression profile of cx43. Since a similar organization of the cx43 gene was also observed in rat it is likely that the complex regulation of cx43 expression involving transcription, splicing and translation mechanisms is a common trait conserved during evolution.


Figures

Figure 1
Figure 1
Identification of new connexin43 5′-UTRs in mouse. (A) RT–PCR of total RNA prepared from various mouse tissues including heart (H), uterus (U), brain (B), mammary gland (MG), liver (Li) and lung (Lu). A common antisense primer annealing to the cx43 coding region and variable forward primers specific to each of the new exons (see Materials and Methods) were used. The PCR products were analyzed in a 2% agarose gel and visualized by ethidium bromide staining. Subcloning and sequencing of the bands confirmed that the products contain the cx43 UTR1A, 1AL, 1AS, 1BL, 1BS-1D, 1BS, 1C-1D, 1C and 1A-1E sequences, as indicated on the right-hand side of the panels. n.s. indicates a non-specific PCR product. On the left-hand side, the positions of the molecular weight markers (PCR markers; Promega) are indicated. (B) Diagram showing the genomic organization of the new cx43 exons, and the splicing combinations found in mouse cx43 mRNAs. Exon1AS and exon1A partially overlap (11 nt). Asterisk indicates exon1AL splices directly to exon2. (C) Diagram showing the structure of the transcripts originated from the mouse cx43 gene.
Figure 2
Figure 2
Identification of new connexin43 5′-UTRs in rat. (A) RT–PCR of total RNA prepared from various rat tissues including heart (H), uterus (U), ovary (O), mammary gland (MG), brain (B) and liver (Li). A common antisense primer annealing to the cx43 coding region and variable forward primers specific to each of the new exons (see Materials and Methods for sequence and details) were used. The PCR products were analyzed in a 2% agarose gel and visualized by ethidium bromide staining. Subcloning and sequencing of the bands confirmed that the products contain the cx43 UTR1A, 1AL, 1AS, 1B, 1CL and 1CS sequences, as indicated on the right-hand side of the panels. n.s. indicates a non-specific PCR product. On the left-hand side, the position of the molecular weight markers (PCR markers; Promega) is indicated. (B) Diagram showing the structure of the transcripts originated from the rat cx43 gene. (C) Diagram showing the genomic organization of the new exons and the splicing combinations found in rat cx43 mRNAs. Exons1AS and exon1A partially overlap (11 nt).
Figure 3
Figure 3
Cell-type-specific expression of the new cx43 exons from three different promoters. (A) RLM-RACE analysis of mouse embryo full-length capped mRNA. Sequencing of the PCR-purified products determined the transcription start sites (tss) for exons 1A, 1B and 1C. With the R1C primer an unspecific product of smaller size was obtained (*). PCR molecular markers (MW) (Promega) are shown. The positions of the tss are indicated by arrows on the cx43 sequence (right part of the figure). The previously determined tss is underlined. The diagram shows the relative position of the reverse primers used in the PCR amplification of the 5′-RACE products. The locations of the putative promoters P2 and P3, with respect to the previously characterized cx43 promoter (P1), are shown by bent arrows. (B) Relative luciferase (Firefly/Renilla) activity of CHO cells transiently transfected with various pGL-Basic constructs. The constructs contained either the cx43 promoter P1 or the putative promoters P2 or P3 sequences in the 5′ to 3′ or the reversed (rev) orientation. The P3(0.2) construct contained 251 nt while the P3 construct contained 1091 nt of sequence upstream of exon 1C. As controls the empty pGLBasic vector (Promega) and the C construct containing 296 nt of cx43 intron sequence immediately upstream of exon1B were used (see Materials and Methods for further details). The fold induction of each construct with respect to the empty pGLB vector is indicated. (C) Semiquantitative RT–PCR analysis of exon1C expression in various mouse tissues, which includes heart (H), uterus (U), ovary (O), brain (B), mammary gland (MG), lung (Lu) and liver (Li). The RT–PCR reactions contained one set of primers annealing to the cx43 coding region and exon1C, and a second set of primers annealing to the β-actin gene (see Materials and Methods for primer sequences). The PCR-amplified products were separated in a 2% agarose gel and visualized by ethidium bromide staining. Positions of the amplified products corresponding to mRNAs either containing (1C-1D) or skipping exon1D (1C) are indicated. Integrated density values (IDVs) of the 1C bands, as determined by the Spotdenso program (Alpha Innotech, Inc.), are shown. (D) RPA analysis of total mouse ovarian RNA (lane 3). The probe was complementary to the entire exon1C (110 nt) and the contiguous 160 nt of exon2. The proportion of exon1C (8.5%) containing transcripts was calculated as a percentage of the exon2-containing transcripts. The IDVs of the bands, as determined by the Spotdenso program, are shown. As controls the probe was hybridized to yeast RNA in the absence (lane 1) or the presence (lane 2) of RNase. The sizes of the PCR molecular weight markers (Promega) are indicated on the left-hand side. (E) RT–PCR analysis of RNA prepared from various parts of the mouse heart which included atrium (A), septum (S) and ventricle tip (V). A common antisense primer annealing to the cx43 coding region and variable forward primers specific to each of the new exons (see Materials and Methods) were used in the amplification. Products were analyzed in a 2% agarose gel and visualized by ethidium bromide staining. Subcloning and sequencing of the bands confirmed that they contained the cx43 UTR1A, 1AL, 1AS, 1BL, 1BS-1D, 1BS, 1C-1D, 1C and 1A-1E sequences, as indicated on the right-hand side of the panels. On the left, the positions of the molecular weight markers (PCR markers; Promega) are indicated.
Figure 4
Figure 4
Varying translational efficiencies of the different cx43 5′-UTRs. (A) Relative luciferase (Firefly/Renilla) activities of various cell lines transiently transfected with 1.2 μg of pcDNA3.1 (Stratagene)-derived constructs containing each of the mouse cx43 5′-UTRs sequences upstream of the luciferase coding region. MCS correspond to the relative luciferase values obtained with the empty pcDNA3.1(+) vector. Cells were co-transfected with 15 ng of the pRL-TK Renilla expressing vector (Promega) to correct for variations in transfection efficiency. Values are expressed as the means ± SE of at least three replicate experiments. The cell lines included HC-11, CHO, NIH3T3 and N2A cells. (B) As in (A), but cells were co-transfected with 1 μg of in vitro transcribed, capped, chimeric cx43 5′-UTR/luciferase reporter mRNAs and 50 ng of Renilla-luciferase mRNA, as indicated. MCS corresponds to the relative luciferase values obtained from the in vitro transcribed luciferase mRNA from pSPluc+[A]60 vector. (C) Semiquatitative RT–PCR analysis of total RNA obtained from N2A cells transfected with in vitro transcribed, capped, either chimeric cx43 5′-UTR/luciferase reporter mRNAs or mRNA transcribed from the empty pSPluc+[A]60 vector (MCS), 6 h after transfection. The RT–PCR reactions contained one set of primers annealing to the Firefly-luciferase coding region (F-luc), and a second set of primers annealing to the β-actin gene (see Materials and Methods for primer sequences). The PCR-amplified products were separated in a 2% agarose gel and visualized by ethidium bromide staining. The positions of the molecular weight markers (PCR markers; Promega) are indicated on the left-hand side.
Figure 5
Figure 5
Exon1E inhibits translation of an exon1A-containing luciferase reporter mRNA. (A) Relative luciferase activity of CHO cells transfected with pcDNA3.1-derived constructs. The constructs contained exon1A cx43 5′-UTR either without (1A) or with exon1E (1A-1E) immediately upstream of the luciferase gene. Construct 1A-1EmATG is construct 1A-1E in which the upstream ATG triplet is mutated. Cells were co-transfected with 50 ng of the pRL-TK Renilla expressing vector (Promega) to correct for variations in transfection efficiency. Values are expressed as the means ± SE of at least three replicate experiments. (B) Same as in (A), but cells were transfected with in vitro transcribed, capped, chimeric cx43 5′-UTR/luciferase reporter RNAs. The 5′-UTR was exon1A or exon1A-1E either wild type or containing a mutation in the uAUG. (C) Structures of exon1A and exon1A-1E 5′-UTRs as predicted by the mFOLD program. Calculated free energies (ΔG) are indicated. The AUG translation start site is pointed by an arrow. (D) Semiquantitative RT–PCR analysis of exon1E expression in various mouse tissues, which included: heart (H), uterus (U), ovary (O), brain (B), mammary gland (MG), lung (Lu) and liver (Li). The RT–PCR reactions contained one set of primers annealing to the cx43 coding region and exon1E, and a second set of primers annealing to the β-actin gene (see Materials and Methods for primer sequences). The PCR-amplified products were separated in a 2% agarose gel and visualized by ethidium bromide staining. IDVs of the bands, as determined by the Spotdenso program (Alpha Innotech, Inc.), are shown. n.d. indicates not determined. (E) RPA analysis of 10 μg of total mouse ovarian RNA (lane 3). The probe was complementary to 110 nt of exon1E and the contiguous 160 nt of exon2. The proportion of exon1E containing transcripts (10%) was calculated as a percentage of the exon2-containing transcripts. The IDVs of the bands, as determined by the Spotdenso program, are shown. As controls, the probe was hybridized to yeast RNA in the absence (lane 1) or the presence (lane 2) of RNase. PCR molecular weight markers (lane 4) (Promega) sizes are indicated on the right-hand side.
Figure 6
Figure 6
Exon1A IRES activity is inhibited by exons 1AS and 1E. (A) Relative luciferase activities of CHO cells transfected with 300 ng of SL2 bicistronic constructs. Exons 1A, 1AL or the 1A-1E combination were present immediately upstream of the Firefly-luciferase coding region. As a positive control for the IRES activity, an SL2-derived construct containing the viral EMCV element was used. The cx32 mutated 5′-UTR M2 was used as a negative control. (B) Structure of exon 1AL as predicted by the mFOLD program. The calculated free energy (ΔG) is indicated. The AUG translation start site is pointed by an arrow. Sequence annealing to oligo AS is labeled with a dotted line. (C) Relative luciferase activities of CHO cells transfected with 300 ng of SL2 bicistronic constructs containing either exon1A or exon1AL. A thioate oligo annealing to 5–27 nt of the exon1AL (oligo AS) was either included (0.5 μM) (+) or excluded (−) in the transfection mixtures and the growing medium.

Similar articles

Cited by

References

    1. Bruzzone R., White,T.W. and Paul,D.L. (1996) Connections with connexins: the molecular basis of direct intercellular signaling. Eur. J. Biochem., 23, 1–27. - PubMed
    1. Bergoffen J., Scherer,S.S., Wang,S., Scott,M.O., Bone,L.J., Paul,D.L., Chen,K., Lensch,M.W., Chance,P.F. and Fischbeck,K.H. (1993) Connexin mutations in X-linked Charcot-Marie-Tooth disease. Science, 262, 2039–2042. - PubMed
    1. Abrahms C.K., Oh,S., Ri,Y. and Bargiello,T.A. (2000) Mutations in connexin 32: the molecular and biophysical bases for the X-linked form of Charcot-Marie-Tooth disease. Brain Res. Rev., 32, 203–214. - PubMed
    1. Kelsell D.P., Di,W.L. and Houseman,M.J. (2001) Connexin mutations in skin disease and hearing loss. Am. J. Hum. Genet., 68, 559–568. - PMC - PubMed
    1. Severs N.J. (2002) Gap junction remodeling in heart failure. J. Card. Fail., 8 (Suppl. 6), S293–S299. - PubMed

Publication types

MeSH terms