

Short interfering RNA-mediated silencing of glutaredoxin 2 increases the sensitivity of HeLa cells toward doxorubicin and phenylarsine oxide
- PMID: 15328416
- PMCID: PMC516552
- DOI: 10.1073/pnas.0401896101
Short interfering RNA-mediated silencing of glutaredoxin 2 increases the sensitivity of HeLa cells toward doxorubicin and phenylarsine oxide
Abstract
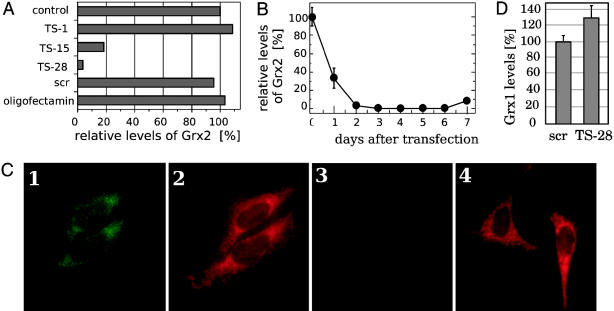
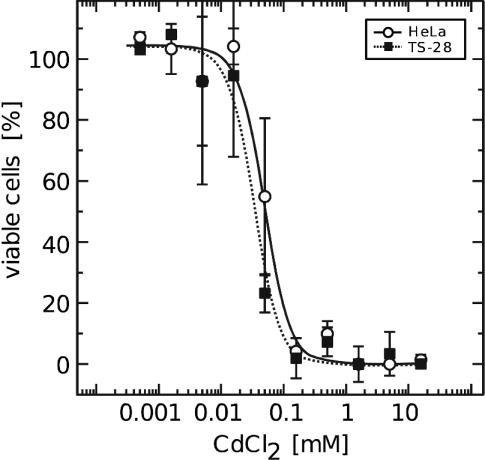
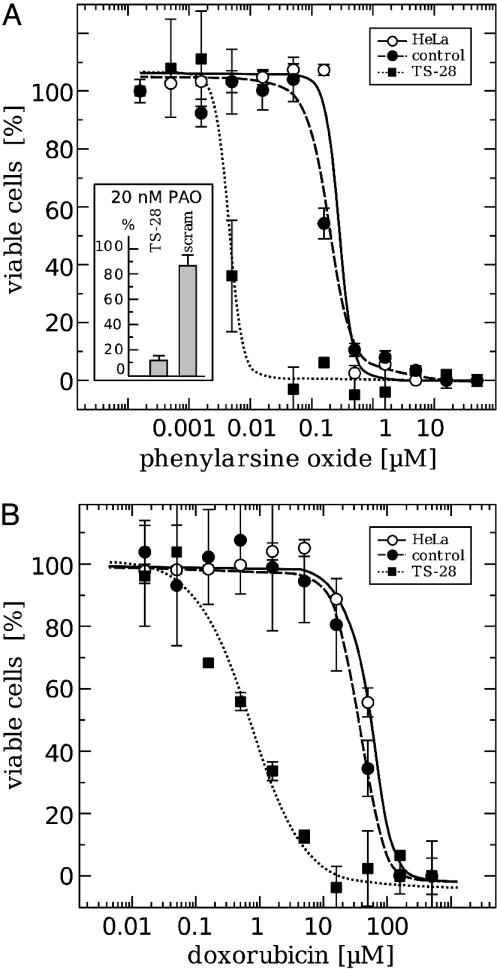
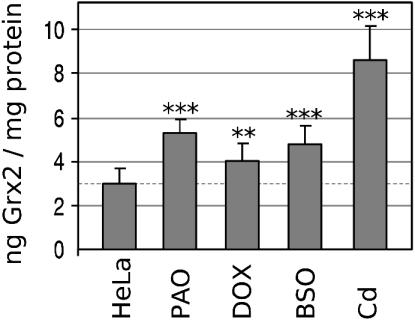
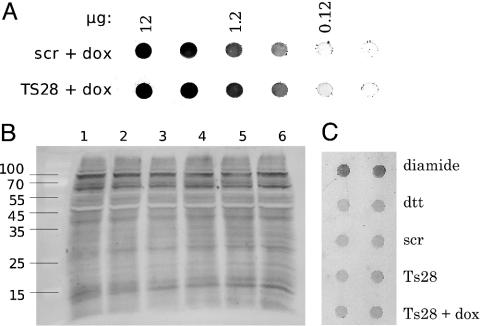
Glutaredoxin (Grx) belongs to the thioredoxin fold superfamily and catalyzes glutathione-dependent oxidoreductions. The recently discovered mitochondrial and nuclear Grx (Grx2) differs from the more abundant cytosolic Grx (Grx1) by its higher affinity toward S-glutathionylated proteins and by being a substrate for thioredoxin reductase. Here, we have successfully established a method to silence the expression of Grx2 in HeLa cells by using short interfering RNA to study its role in the cell. Cells with levels of Grx2 <3% of the control were dramatically sensitized to cell death induced by doxorubicin/adriamycin and phenylarsine oxide but did not show signs of a general increase in oxidative damage with respect to carbonylation and glutathionylation. The ED(50) for doxorubicin dropped from 40 to 0.7 microM and for phenylarsine oxide from 200 to 5 nM. However, no differences were detected after treatment with cadmium, a known inhibitor of Grx1. These results indicate a crucial role of Grx2 in the regulation of the mitochondrial redox status and regulation of cell death at the mitochondrial checkpoint.
Figures
Similar articles
-
Human mitochondrial glutaredoxin reduces S-glutathionylated proteins with high affinity accepting electrons from either glutathione or thioredoxin reductase.J Biol Chem. 2004 Feb 27;279(9):7537-43. doi: 10.1074/jbc.M312719200. Epub 2003 Dec 4. J Biol Chem. 2004. PMID: 14676218
-
Cloning and expression of a novel human glutaredoxin (Grx2) with mitochondrial and nuclear isoforms.J Biol Chem. 2001 Jul 13;276(28):26269-75. doi: 10.1074/jbc.M011605200. Epub 2001 Apr 10. J Biol Chem. 2001. PMID: 11297543
-
Identification and characterization of a new mammalian glutaredoxin (thioltransferase), Grx2.J Biol Chem. 2001 Aug 10;276(32):30374-80. doi: 10.1074/jbc.M100020200. Epub 2001 Jun 7. J Biol Chem. 2001. PMID: 11397793
-
Glutaredoxins: glutathione-dependent redox enzymes with functions far beyond a simple thioredoxin backup system.Antioxid Redox Signal. 2004 Feb;6(1):63-74. doi: 10.1089/152308604771978354. Antioxid Redox Signal. 2004. PMID: 14713336 Review.
-
Thiol redox control via thioredoxin and glutaredoxin systems.Biochem Soc Trans. 2005 Dec;33(Pt 6):1375-7. doi: 10.1042/BST0331375. Biochem Soc Trans. 2005. PMID: 16246122 Review.
Cited by
-
Determination of protein carbonyls in plasma, cell extracts, tissue homogenates, isolated proteins: Focus on sample preparation and derivatization conditions.Redox Biol. 2015 Aug;5:367-380. doi: 10.1016/j.redox.2015.06.005. Epub 2015 Jun 18. Redox Biol. 2015. PMID: 26141921 Free PMC article. Review.
-
Glutaredoxin 2 reduces both thioredoxin 2 and thioredoxin 1 and protects cells from apoptosis induced by auranofin and 4-hydroxynonenal.Antioxid Redox Signal. 2014 Aug 10;21(5):669-81. doi: 10.1089/ars.2013.5499. Epub 2014 Feb 4. Antioxid Redox Signal. 2014. PMID: 24295294 Free PMC article.
-
Augmented S-nitrosylation contributes to impaired relaxation in angiotensin II hypertensive mouse aorta: role of thioredoxin reductase.J Hypertens. 2011 Dec;29(12):2359-68. doi: 10.1097/HJH.0b013e32834d2554. J Hypertens. 2011. PMID: 22025239 Free PMC article.
-
Pharmacological inhibition of cystine-glutamate exchange induces endoplasmic reticulum stress and ferroptosis.Elife. 2014 May 20;3:e02523. doi: 10.7554/eLife.02523. Elife. 2014. PMID: 24844246 Free PMC article.
-
Glutaredoxin 2 prevents aggregation of mutant SOD1 in mitochondria and abolishes its toxicity.Hum Mol Genet. 2010 Nov 15;19(22):4529-42. doi: 10.1093/hmg/ddq383. Epub 2010 Sep 9. Hum Mol Genet. 2010. PMID: 20829229 Free PMC article.
References
-
- Holmgren, A. (1989) J. Biol. Chem. 264, 13963–13966. - PubMed
-
- Fernandes, A. P. & Holmgren, A. (2004) Antioxid. Redox Signal. 6, 63–74. - PubMed
-
- Vlamis-Gardikas, A. & Holmgren, A. (2002) Methods Enzymol. 347, 286–296. - PubMed
-
- Spyrou, G., Enmark, E., Miranda-Vizuete, A. & Gustafsson, J. (1997) J. Biol. Chem. 272, 2936–2941. - PubMed
-
- Miranda-Vizuete, A., Damdimopoulos, A. E., Pedrajas, J. R., Gustafsson, J. A. & Spyrou, G. (1999) Eur. J. Biochem. 261, 405–412. - PubMed
Publication types
MeSH terms
Substances
LinkOut - more resources
Full Text Sources
Molecular Biology Databases
