. 2004 Oct;2(10):e288.
doi: 10.1371/journal.pbio.0020288. Epub 2004 Aug 24.

Loss of skeletal muscle HIF-1alpha results in altered exercise endurance

Affiliations

Loss of skeletal muscle HIF-1alpha results in altered exercise endurance

Steven D Mason et al. PLoS Biol. 2004 Oct.

Abstract

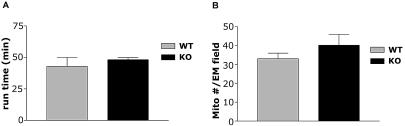
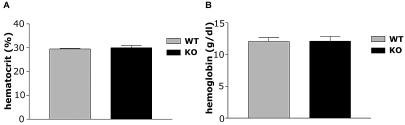
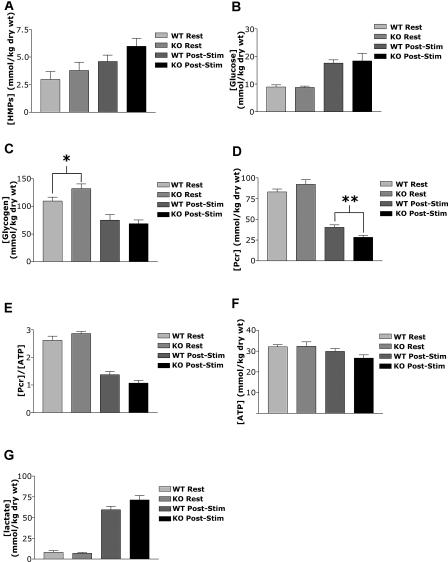
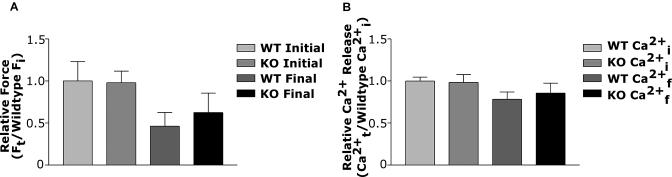
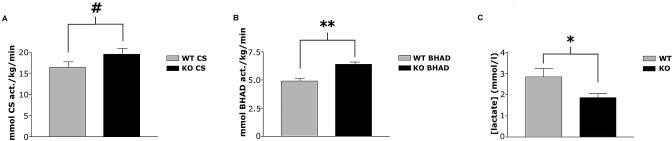
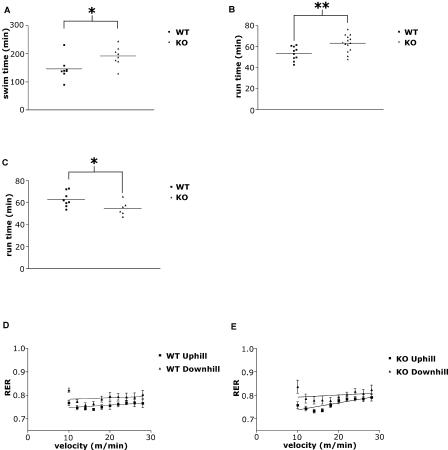
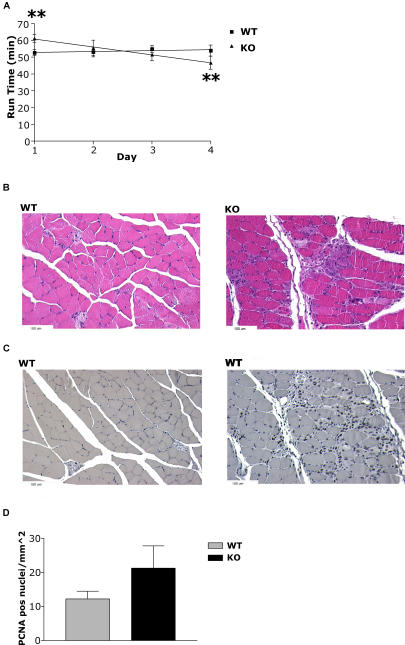
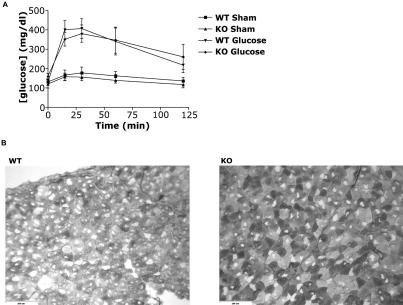
The physiological flux of oxygen is extreme in exercising skeletal muscle. Hypoxia is thus a critical parameter in muscle function, influencing production of ATP, utilization of energy-producing substrates, and manufacture of exhaustion-inducing metabolites. Glycolysis is the central source of anaerobic energy in animals, and this metabolic pathway is regulated under low-oxygen conditions by the transcription factor hypoxia-inducible factor 1alpha (HIF-1alpha). To determine the role of HIF-1alpha in regulating skeletal muscle function, we tissue-specifically deleted the gene encoding the factor in skeletal muscle. Significant exercise-induced changes in expression of genes are decreased or absent in the skeletal-muscle HIF-1alpha knockout mice (HIF-1alpha KOs); changes in activities of glycolytic enzymes are seen as well. There is an increase in activity of rate-limiting enzymes of the mitochondria in the muscles of HIF-1alpha KOs, indicating that the citric acid cycle and increased fatty acid oxidation may be compensating for decreased flow through the glycolytic pathway. This is corroborated by a finding of no significant decreases in muscle ATP, but significantly decreased amounts of lactate in the serum of exercising HIF-1alpha KOs. This metabolic shift away from glycolysis and toward oxidation has the consequence of increasing exercise times in the HIF-1alpha KOs. However, repeated exercise trials give rise to extensive muscle damage in HIF-1alpha KOs, ultimately resulting in greatly reduced exercise times relative to wild-type animals. The muscle damage seen is similar to that detected in humans in diseases caused by deficiencies in skeletal muscle glycogenolysis and glycolysis. Thus, these results demonstrate an important role for the HIF-1 pathway in the metabolic control of muscle function.


Conflict of interest statement

The authors have declared that no conflicts of interest exist.

Figures

Figure 1
Figure 1. Exercise Capacity of Cardiac HIF-1α KOs and HIF-1α/MCK/cre Mitochondrial Density
(A) Mice lacking cardiac HIF-1α perform no differently in endurance running trials than WT mice, showing that the increase in exercise capacity seen in MCK/Cre mice is due to deletion of HIF-1α in skeletal muscle, not cardiac tissue. (B) Mice lacking skeletal muscle HIF-1α have a slight but nonsignificant increase in mitochondrial density as measured by the number of mitochondria per electron microscope field of view.
Figure 2
Figure 2. Hematocrit and Hemoglobin Levels in HIF-1α KOs and WT Mice
(A) Hematocrit levels are virtually identical in both HIF-1α KOs (n = 3) and WT (n = 4) mice, indicating that loss of HIF-1α in skeletal muscle does not affect oxygen carrying capacity of the blood. (B) In addition to similar hematocrit levels, WT mice and HIF-1α KOs have very close blood hemoglobin levels.
Figure 3
Figure 3. Intramuscular Metabolite Levels at Rest and Following Stimulation
(A) Glycolytic intermediates were measured from gastrocnemius muscles following the isolated stimulation protocol. Resting values represent levels in the unstimulated gastrocnemius from the same animals. HIF-1α KOs had a trend toward greater accumulated levels of HMPs during the stimulation protocol, although the difference did not reach statistical significance (p = 0.10). This difference could be indicative of a blockage in the glycolytic pathway at PFK. (B) No significant differences were seen between HIF-1α KOs and WT intramuscular glucose levels at rest or following stimulation. Both HIF-1α KO and WT muscles were able to significantly increase glucose uptake, leading to greater levels of intramuscular glucose in response to stimulation (WT, p < 0.001; KO, p < 0.05). (C) HIF-1α KOs have more stored glycogen than do WT mice. Glycogen levels were measured following the same stimulation protocol as in (B). The change in glycogen from rest to poststimulation was also greater in the HIF-1α KOs, indicating that they metabolized more glycogen in response to stimulation (p < 0.01; *p < 0.05, WT at rest vs. KO at rest). (D) HIF-1α KOs utilize more PCr in response to stimulation than do WT mice. Similar levels of PCr were seen at rest, but HIF-1α KOs metabolized significantly more during stimulation (p < 0.05) and had much lower levels following the protocol (**p < 0.01, WT poststimulation vs. KO poststimulation). (E) A trend toward lower PCr/ATP concentration ratios was seen in HIF-1α KOs relative to WT mice following stimulation, although the difference did not quite reach statistical significance (p < 0.10). A trend toward a greater drop from rest to poststimulation in the PCr/ATP ratio was also seen in HIF-1α KOs following stimulation (p < 0.10), indicating that they had to rely more heavily on PCr for ATP generation. (F) Slight but nonsignificant differences were seen in whole-muscle ATP levels at rest or following stimulation. Although HIF-1α KOs exhibited altered substrate utilization, they were able to meet their ATP demands during the protocol. (G) Both HIF-1α KOs and WT animals produced significant intramuscular lactate during the stimulation protocol; however, there was no significant difference in the amount produced by either genotype. Resting intramuscular lactate levels were also similar for WTs and HIF-1α KOs.
Figure 4
Figure 4. Force Generation and Ca2+ Release in Isolated Muscle Fibers during Stimulation
(A) No differences were seen in total force generation in isolated muscle fibers. Mechanically dissected fibers from the flexor brevis muscle were subjected to a fatiguing protocol. Neither initial nor final forces differed between HIF-1α KO and WT fibers. (B) Ca2+ release and reuptake in HIF-1α KO and WT fibers was not different during the stimulation protocol. Ca2+ levels were measured in individual fibers through use of fura-2 Ca2+ indicator. The altered substrate utilization did not affect the ability of the fibers to maintain proper Ca2+ flux.
Figure 5
Figure 5. Oxidative Metabolism and Serum Lactate Production in HIF-1α KOs and WT Mice
(A) HIF-1α KOs have higher resting levels of CS activity. CS is an enzyme in the Krebs cycle that can be regulated allosterically by ATP levels. Increased CS activity is indicative of increased muscle oxidative capacity, which is common in patients with glycogenolytic or glycolytic myopathies (# p < 0.10, KO vs. WT). (B) HIF-1α KOs have higher resting levels of B-HAD activity, which is indicative of a greater ability to oxidize fatty acids (**p < 0.01, WT vs. KO). (C) Lower serum lactate levels were seen in HIF-1α KOs following a timed 25-minute run (*p < 0.05, WT vs. KO).
Figure 6
Figure 6. Endurance Capabilities of Untrained Mice
(A) HIF-1α KOs have greater endurance in swimming tests as shown by their ability to swim on average more than 45 min longer than WT (*p < 0.05, WT vs. KO). (B) HIF-1α KOs have greater endurance than WT mice in uphill running tests. Although only a 10-min difference is seen between run times, it is to be noted that because of the protocol, this 10 min included two velocity increases (**p < 0.01, WT vs. KO). (C) HIF-1α KOs have less endurance than WT mice in downhill running tests. The same protocol was used as in Figure 4A, except the mice were run on a 10° decline (*p < 0.05, WT vs. KO). (D) RER uphill vs. downhill in WT mice. As would be expected from eccentric exercises relying more heavily on glycolytic fibers, the RER values are higher in mice running downhill than in those running uphill. (E) RER uphill vs. downhill in HIF-1α KOs. Once again, higher RER values are observed for mice running downhill than those running uphill.
Figure 7
Figure 7. Increased Muscle Damage in HIF-1α KOs Following Repeated Exercise
(A) WT mice and HIF-1α KOs underwent a 4-d endurance test, in which animals were run to exhaustion on each of four successive days with a minimum of 22 h rest between trials. HIF-1α KOs demonstrated initially greater endurance under the protocol; however, by the second day, their endurance advantage was eliminated, and by the fourth day, HIF-1α KOs were running for a significantly shorter time (**p < 0.01) than on the first day, while WT animals were running for approximately similar times as on the first day. Repeated measures ANOVA revealed that the decrease in performance on each successive day was unique to HIF-1α KOs (p < 0.05). (B) Example of hematoxylin and eosin staining of gastrocnemius muscles after 1 d of recovery by mice after the 4-d endurance test. Evidence of greater damage can be seen in HIF-1α KO muscles compared to WT muscles. (C) Example of PCNA staining of gastrocnemius muscles from exercised mice, demonstrating increased levels of muscle regeneration in HIF-1α KOs. (D) Number of PCNA-positive nuclei per square millimeter in gastrocnemius muscles of WT mice (n = 5) and HIF-1α KOs (n = 7) that ran repeatedly for 4 d. Although HIF-1α KOs have almost twice as many PCNA-positive nuclei per square millimeter, the difference is not significant, because of wild variations in that population. F-test analysis of the data reveals that the variance is much greater in the HIF-1α KO population than the WT population (p < 0.05).
Figure 8
Figure 8. Glucose Tolerance and Glycogen Storage
(A) No significant differences were seen in resting blood glucose levels in HIF-1α KOs or WT mice. Following injection of glucose at a dosage of 2 g/kg, no differences were seen in the maximum levels of blood glucose or the rate of glucose disappearance in either genotype. (B) Representative PAS staining of gastrocnemius muscle from WT mice and HIF-1α KOs. HIF-1α KOs demonstrate darker staining, indicating more stored glycogen.

Similar articles

Cited by

References

    1. Argov Z, Bank WJ, Maris J, Leigh JS, Chance B. Muscle energy metabolism in human phosphofructokinase deficiency as recorded by 31P nuclear magnetic resonance spectroscopy. Ann Neurol. 1987;22:46–51. - PubMed
    1. Bancroft JD, Stevens A. New York: Churchill Livingstone; 1996. Theory and practice of histological techniques, 4th ed; 766 pp.
    1. Bergmeyer HU. New York: Academic Press; 1974. Methods of enzymatic analysis; 2302 pp.
    1. Bruning JC, Michael MD, Winnay JN, Hayashi T, Horsch D, et al. A muscle-specific insulin receptor knockout exhibits features of the metabolic syndrome of NIDDM without altering glucose tolerance. Mol Cell. 1998;2:559–569. - PubMed
    1. Cramer T, Yamanishi Y, Clausen BE, Forster I, Pawlinski R, et al. HIF-1α is essential for myeloid cell-mediated inflammation. Cell. 2003;112:645–657. - PMC - PubMed

MeSH terms