. 2004 Dec;71(6):2079-86.
doi: 10.1095/biolreprod.104.030841. Epub 2004 Aug 25.

Epidermal growth factor and interleukin-1beta utilize divergent signaling pathways to synergistically upregulate cyclooxygenase-2 gene expression in human amnion-derived WISH cells

Affiliations

Epidermal growth factor and interleukin-1beta utilize divergent signaling pathways to synergistically upregulate cyclooxygenase-2 gene expression in human amnion-derived WISH cells

William E Ackerman 4th et al. Biol Reprod. 2004 Dec.

Abstract

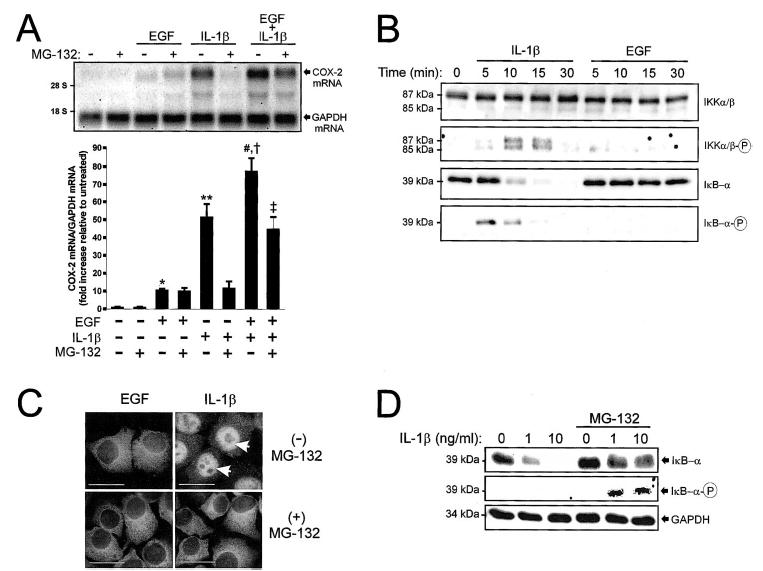
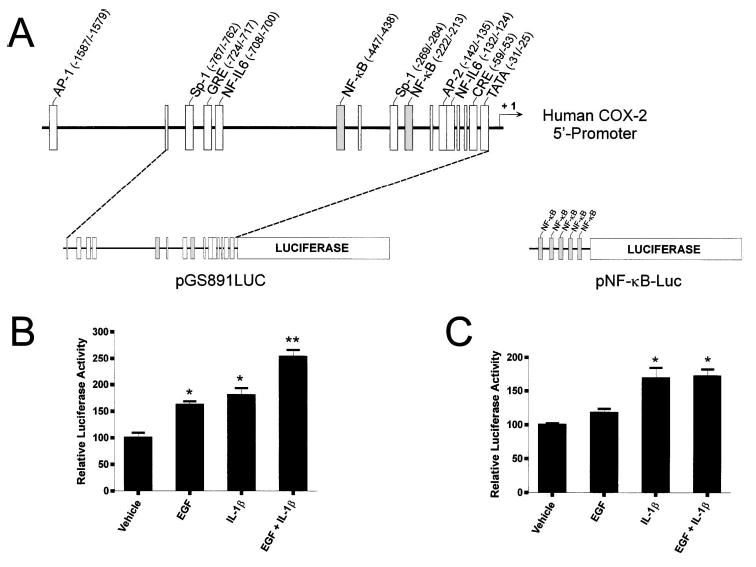
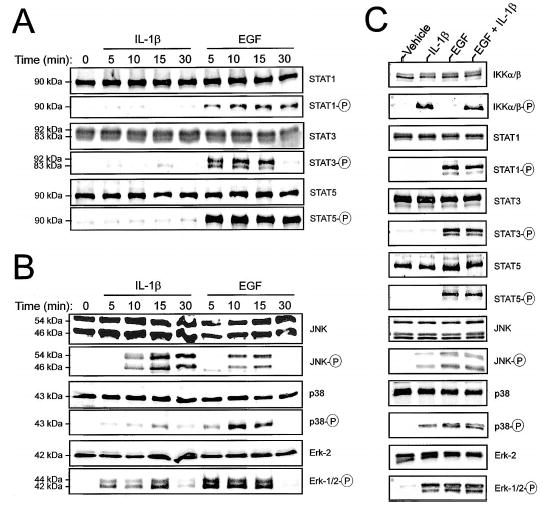
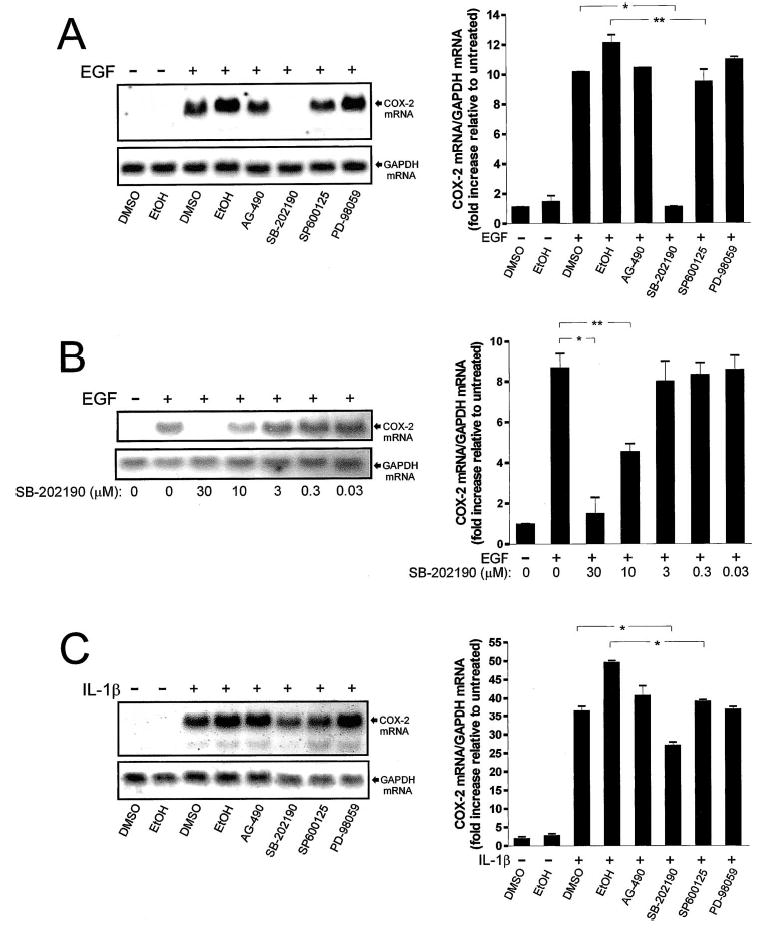
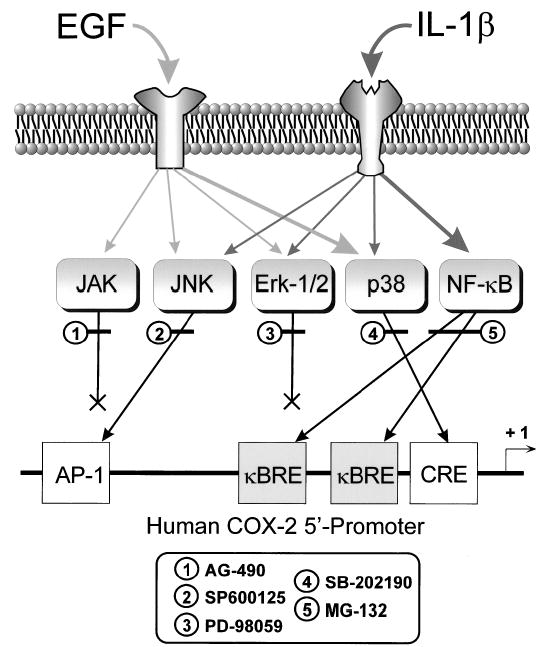
In human parturition, uterotonic prostaglandins (PGs) arise predominantly via increased expression of cyclooxygenase-2 (COX-2 [also known as prostaglandin synthase 2]) within intrauterine tissues. Interleukin-1 (IL-1) and epidermal growth factor (EGF), both inducers of COX-2 transcription, are among numerous factors that accumulate within amniotic fluid with advancing gestation. It was previously demonstrated that EGF could potentiate IL-1beta-driven PGE(2) production in amnion and amnion-derived (WISH) cells. To define the mechanism for this observation, we hypothesized that EGF and IL-1beta might exhibit synergism in regulating COX-2 gene expression. In WISH cells, combined treatment with EGF and IL-1beta resulted in a greater-than-additive increase in COX-2 mRNA relative to challenge with either agent independently. Augmentation of IL-1beta-induced transactivation by EGF was not observed in cells harboring reporter plasmids bearing nuclear factor-kappa B (NFkappaB) regulatory elements alone, but was evident when a fragment (-891/ +9) of the COX-2 gene 5'-promoter was present. Both agents transiently activated intermediates of multiple signaling pathways potentially involved in the regulation of COX-2 gene expression. The 26 S proteasome inhibitor, MG-132, selectively abrogated IL-1beta-driven NFkappaB activation and COX-2 mRNA expression. Only pharmacologic blockade of the p38 mitogen-activated protein kinase eliminated COX-2 expression following EGF stimulation. We conclude that EGF and IL-1beta appear to signal through different signaling cascades leading to COX-2 gene expression. IL-1beta employs the NFkappaB pathway predominantly, while the spectrum of EGF signaling is broader and includes p38 kinase. The synergism observed between IL-1beta and EGF does not rely on augmented NFkappaB function, but rather, occurs through differential use of independent response elements within the COX-2 promoter.


Figures

FIG. 1
FIG. 1
Effects of EGF and IL-1β on NFκB activation and COX-2 mRNA expression. A) Northern blots were prepared from WISH cell lysates 1 h following individual or combined challenge with EGF (10 ng/ml) and IL-1β (10 ng/ml) in the presence or absence of MG-132 (30 μM). COX-2 mRNA was detected using a UTP-DIG-labeled 1.8-kb cDNA encoding human COX-2. Chemiluminescent detection of COX-2 mRNA (4.5-kb band) was quantified by densitometric scanning. The amount of COX-2 mRNA in the absence of EGF, IL-1β, and MG-132 was set to 1. Data were normalized to GAPDH mRNA levels in each treatment group, standardized in relation to the control (untreated) group, and represented graphically (mean ± SEM, n = 3 individual experiments). *, P < 0.05 vs. untreated; **, P < 0.001 vs. untreated; #, P < 0.001 vs. EGF; , P < 0.05 vs. IL-1β; , P < 0.01 vs. EGF/ IL-1β combined (ANOVA). B) Cells were treated with IL-1β or EGF for 0–30 min and prepared for immunoblot analysis. Activation of NFκB was assessed using antibodies detecting phosphorylated and nonphosphorylated forms of IKKα (85 kDa), IKKβ (87 kDa), and IκB-α (39 kDa). C) Intracellular localization of NFκB subunit p65 was detected by immunofluorescence in cells treated with EGF or IL-1β for 15 min in the presence or absence of MG-132. Arrows denote nuclear localization of p65 in the presence of IL-1β alone. Bars = 20 μm. D) Immunoblots were prepared from cells treated for 15 min with 0–10 ng/ml IL-1β in the presence or absence of MG-132 and probed with antibodies detecting either total IκB-α (top panel) or phosphorylated IκB-α (Ser32, bottom panel).
FIG. 2
FIG. 2
Individual and combined effects of EGF and IL-1β on COX-2 promoter-dependent luciferase expression. A) Diagram showing enhancer elements located within the human COX-2 5′-promoter, pPGS891LUC, and pNFκB-Luc. The two κB regulatory elements within the human COX-2 5′-promoter (located at −447/−438 bp and −222/−213 bp upstream of the transcriptional start site) are depicted in gray boxes. NFκB, Nuclear factorκB response element; NF-IL6, nuclear factor-interleukin-6 response element; AP-1, activator protein-1 response element; CRE, cAMP response element; GRE, glucocorticoid receptor response element; Sp-1, selective promoter factor-1 response element; AP-2, activating protein-2 response element; TATA, TATA box. Based on data by Tazawa et al. [13] and Allport et al. [23]. B, C) Cells were transiently transfected with pPGS891LUC [13] or pNFκB-Luc [28]. Twenty-four h after transfection, cells were treated with EGF (10 ng/ml), IL-1β (10 ng/ml), or both for 4 h and then processed. Firefly luciferase activity was normalized to Renilla luciferase activity in each lysate. Each bar represents the mean ± SEM of four replicates from two experiments. *, P < 0.01 vs. control; **, P < 0.001 vs. control (ANOVA).
FIG. 3
FIG. 3
Activation of JAK/STAT and MAP kinase signaling intermediates following challenge with IL-1β or EGF. A, B) Cells were treated with IL-1β (10 ng/ml) or EGF (10 ng/ml) for 0–30 min and prepared for immunoblot analysis. Activation of the JAK/STAT signaling cascade was assessed by probing with antibodies recognizing total and phosphorylated forms of STAT1 (90 kDa), STAT3 (83 and 92 kDa), and STAT5 (90 kDa). Activation of the major MAP kinase signaling cascades (B) was assessed using antibodies recognizing total Erk-2 (42 kDa), dually phosphorylated Erk-1 (44 kDa)/Erk-2 (42 kDa), total and phosphorylated p38 (43 kDa), and total and phosphorylated JNK-1 (46 kDa)/JNK-2 (54 kDa). C) Cells were treated with EGF and IL-1β individually or in combination for 12.5 min and prepared for immunodetection of activated signaling intermediates. These blots are representative of four independent experiments.
FIG. 4
FIG. 4
Effect of pharmacological inhibition of MAP kinase and JAK/STAT signaling cascades on EGF- and IL-1β-driven COX-2 mRNA expression. A) Representative Northern blot demonstrating COX-2 mRNA levels 1 h following treatment with vehicles alone (0.6% EtOH, 0.8% DMSO), vehicles with EGF (10 ng/ml), or EGF in the presence of AG-490 (50 μM), SB-202190 (30 μM), SP600125 (30 μM), or PD-98059 (45 μM). Chemiluminescent detection of COX-2 mRNA (4.5-kb band) was quantified by densitometric scanning. Data were normalized to GAPDH mRNA levels in each treatment group, standardized in relation to the control (untreated) group, and represented graphically. At the settings chosen for presentation, the low levels of basal COX-2 mRNA expression in these Northern blots are not readily discerned. B) Representative Northern blot demonstrating COX-2 mRNA levels 1 h following treatment with vehicle alone (0.8% DMSO), vehicle with EGF, or EGF in the presence 0.03–30 μM SB-202190. C) Representative Northern blot and densitometric analysis demonstrating COX-2 mRNA levels 1 h following treatment with vehicles alone (0.6% EtOH, 0.8% DMSO), vehicles with IL-1β (10 ng/ml), or IL-1β in the presence of AG-490 (50 μM), SB-202190 (30 μM), SP600125 (30 μM), or PD-98059 (45 μM). Each bar represents the mean ± SEM for two or three individual experiments, which were run in duplicate. *, P < 0.01 vs. indicated treatment group; **, P < 0.05 vs. indicated treatment group.
FIG. 5
FIG. 5
Schematic diagram of signaling pathways activated by EGF and IL-1β to upregulate COX-2 mRNA expression in amnion-derived WISH cells. Pathways used by EGF are depicted by light gray arrows, while those activated by IL-1β are depicted by dark gray arrows. Major signaling pathways activated by each agent are represented by the larger arrows. Target response element within the COX-2 5′-promoter region that are potentially employed by these signaling cascades are shown, as are the sites of action of the pharmacological inhibitors used in this study. κBRE, Nuclear factorκB response element; AP-1, activator protein-1 response element; CRE, cAMP response element.

Similar articles

Cited by

References

    1. Kniss DA, Iams JD. Regulation of parturition update. Endocrine and paracrine effectors of term and preterm labor. Clin Perinatol. 1998;25:819–836. - PubMed
    1. Kniss DA. Cyclooxygenases in reproductive medicine and biology. J Soc Gynecol Invest. 1999;6:285–292. - PubMed
    1. Johnson RF, Mitchell CM, Giles WB, Walters WA, Zakar T. The in vivo control of prostaglandin H synthase-2 messenger ribonucleic acid expression in the human amnion at parturition. J Clin Endocrinol Metab. 2002;87:2816–2823. - PubMed
    1. Keelan JA, Blumenstein M, Helliwell RJ, Sato TA, Marvin KW, Mitchell MD. Cytokines, prostaglandins and parturition—a review. Placenta. 2003;24(suppl A):S33–S46. - PubMed
    1. Bowen JM, Chamley L, Keelan JA, Mitchell MD. Cytokines of the placenta and extra-placental membranes: roles and regulation during human pregnancy and parturition. Placenta. 2002;23:257–273. - PubMed

Publication types

MeSH terms