Memory of learning facilitates saccadic adaptation in the monkey
- PMID: 15329400
- PMCID: PMC6729647
- DOI: 10.1523/JNEUROSCI.1741-04.2004
Memory of learning facilitates saccadic adaptation in the monkey
Abstract
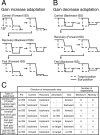
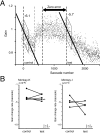
A motor learning mechanism called saccadic adaptation ensures accuracy of saccades throughout life despite growth, aging, and some pathologies of the oculomotor plant or nervous system. The present study investigates effects of preceding adaptation on the speed of subsequent adaptation during single experiments. Adaptive changes in gain (movement size divided by target eccentricity) were induced by intrasaccadic step (ISS) of the target. After the gain was altered (control block), we reversed the direction of ISS to bring the gain back to approximately 1.0 (recovery). We then reversed ISS direction again to induce another adaptation (test block). Analyses revealed that the gain changed at a higher rate in the early part of test adaptation than in the corresponding part of control. After approximately 100-300 saccades in the test block, adaptation slowed down. The gain value at which adaptation slowed was correlated with the gain achieved in the control. We further examined effects of a 30 min intervention inserted between recovery and test blocks. When zero-visual-error trials ( approximately 700 saccades) were repeated during this period, the rate of test adaptation was similar to that of control. In contrast, when the animal was deprived of visual inputs during this period, test adaptation was still influenced by preceding learning. We conclude that a memory of previous learning remains during recovery to facilitate subsequent adaptation and that such a memory does not disappear merely with time but is erased actively by repeated zero-error movements. Our results, which cannot be explained by a single mechanism, suggest that the saccadic system is equipped with more than one plasticity process.
Figures


Similar articles
-
Saccadic gain modification: visual error drives motor adaptation.J Neurophysiol. 1998 Nov;80(5):2405-16. doi: 10.1152/jn.1998.80.5.2405. J Neurophysiol. 1998. PMID: 9819252
-
Characteristics of saccadic gain adaptation in rhesus macaques.J Neurophysiol. 1997 Feb;77(2):874-95. doi: 10.1152/jn.1997.77.2.874. J Neurophysiol. 1997. PMID: 9065856
-
Changes in cerebellar fastigial burst activity related to saccadic gain adaptation in the monkey.Neurosci Res. 2003 Jul;46(3):359-68. doi: 10.1016/s0168-0102(03)00098-1. Neurosci Res. 2003. PMID: 12804797
-
Saccade adaptation as a model of flexible and general motor learning.Exp Eye Res. 2013 Sep;114:6-15. doi: 10.1016/j.exer.2013.04.001. Epub 2013 Apr 15. Exp Eye Res. 2013. PMID: 23597598 Free PMC article. Review.
-
The characteristics and neuronal substrate of saccadic eye movement plasticity.Prog Neurobiol. 2004 Jan;72(1):27-53. doi: 10.1016/j.pneurobio.2003.12.002. Prog Neurobiol. 2004. PMID: 15019175 Review.
Cited by
-
Eliminating Direction Specificity in Visuomotor Learning.J Neurosci. 2016 Mar 30;36(13):3839-47. doi: 10.1523/JNEUROSCI.2712-15.2016. J Neurosci. 2016. PMID: 27030768 Free PMC article.
-
Saccadic adaptation to moving targets.PLoS One. 2012;7(6):e39708. doi: 10.1371/journal.pone.0039708. Epub 2012 Jun 29. PLoS One. 2012. PMID: 22768109 Free PMC article.
-
Saccade adaptation as a model of learning in voluntary movements.Exp Brain Res. 2010 Jul;204(2):145-62. doi: 10.1007/s00221-010-2314-3. Epub 2010 Jun 11. Exp Brain Res. 2010. PMID: 20544185 Review.
-
Estimating the relevance of world disturbances to explain savings, interference and long-term motor adaptation effects.PLoS Comput Biol. 2011 Oct;7(10):e1002210. doi: 10.1371/journal.pcbi.1002210. Epub 2011 Oct 6. PLoS Comput Biol. 2011. PMID: 21998574 Free PMC article.
-
Similarities in error processing establish a link between saccade prediction at baseline and adaptation performance.J Neurophysiol. 2014 May;111(10):2084-93. doi: 10.1152/jn.00779.2013. Epub 2014 Mar 5. J Neurophysiol. 2014. PMID: 24598520 Free PMC article.
References
-
- Boyden ES, Raymond JL (2003) Active reversal of motor memories reveals rules governing memory encoding. Neuron 39: 1031-1042. - PubMed
-
- Deubel H, Elsner T, Hauske G (1987) Saccadic eye movements and the detection of fast-moving gratings. Biol Cybern 57: 37-45. - PubMed
-
- Frens MA, van Opstal AJ (1994) Transfer of short-term adaptation in human saccadic eye movements. Exp Brain Res 100: 293-306. - PubMed
-
- Frey PW, Ross LE (1968) Classical conditioning of the rabbit eyelid response as a function of interstimulus interval. J Comp Physiol Psychol 65: 246-250. - PubMed
Publication types
MeSH terms
LinkOut - more resources
Full Text Sources
Other Literature Sources
