Review
. 2004 Aug 26:2:15.
doi: 10.1186/1476-7120-2-15.

Combination of contrast with stress echocardiography: a practical guide to methods and interpretation

Affiliations
Review

Combination of contrast with stress echocardiography: a practical guide to methods and interpretation

Stuart Moir et al. Cardiovasc Ultrasound. .

Abstract

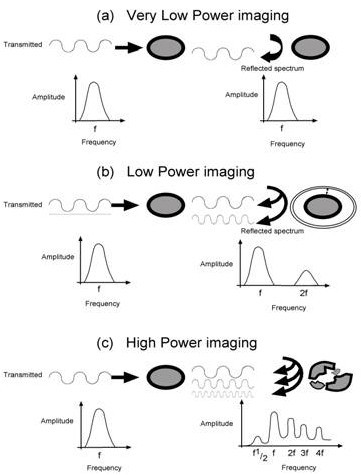
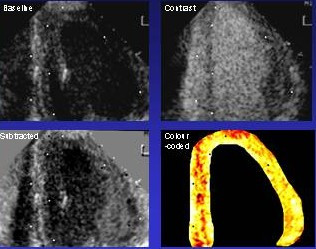
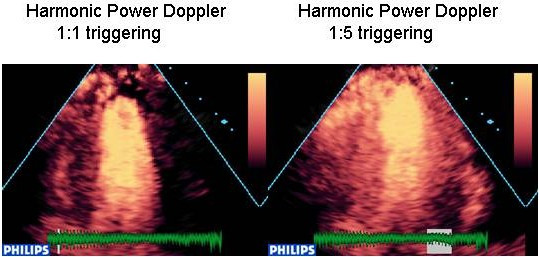
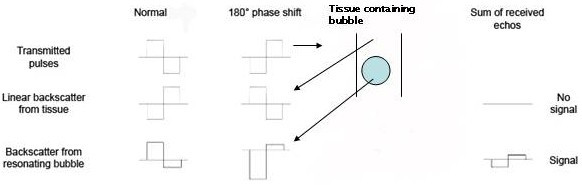
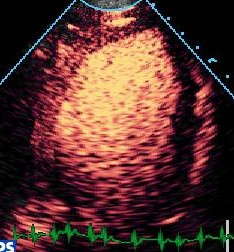
Contrast echocardiography has an established role for enhancement of the right heart Doppler signals, the detection of intra-cardiac shunts, and most recently for left ventricular cavity opacification (LVO). The use of intravenously administered micro-bubbles to traverse the myocardial microcirculation in order to outline myocardial viability and perfusion has been the source of research studies for a number of years. Despite the enthusiasm of investigators, myocardial contrast echocardiography (MCE) has not attained routine clinical use and LV opacification during stress has been less widely adopted than the data would support. The purpose of this review is to facilitate an understanding of the involved imaging technologies that have made this technique more feasible for clinical practice, and to guide its introduction into the practice of the non-expert user.


Figures

Figure 1
Figure 1
Interaction of micro-bubbles and ultrasound.
Figure 2
Figure 2
Digital subtraction and colour coding of MCE images acquired using intermittent harmonic imaging.
Figure 3
Figure 3
Harmonic power Doppler imaging [see also additional file 1]
Figure 4
Figure 4
Pulse inversion Doppler.
Figure 11
Figure 11
Destruction replenishment imaging with real time MCE – see text.
Figure 5
Figure 5
Importance of machine settings for using contrast for LV opacification. (a) In this example, endocardial border definition is probably adequate with standard tissue harmonic imaging – [see additional file 2.] (b) The use of contrast for LVO with standard diagnostic harmonic imaging machine settings provides worse border definition in the lateral wall, and apical bubble destruction, illustrating the importance of appropriate machine settings – [see additional file 3]. Image (c) shows machine settings for myocardial perfusion imaging – this provides assessment of myocardial perfusion and wall motion, but the frame rate for WMA is 20–25 Hz and thus subtle WMA's could be missed – [see additional file 4]. Therefore for optimal assessment of WMA image (d) displays specific intermediate MI imaging at high frame rate designed specifically to enhance the endocardial/cavity border. Even in this example there is some apical swirling despite the focal zone set in the mid LV – [see also additional file 5].
Figure 6
Figure 6
Realtime 3D echocardiography without (a) – [additional file 6], and with contrast enhancement (b) [additional file 7]. There is clear benefit for LV border detection. [See also additional files 8 and 9 for real time 3-D movies without and with contrast respectively.]
Figure 7
Figure 7
End systolic frames of 4CV at rest (left) and post stress (right). Note there is no obvious difference in the shape of the cavity on the grey scale images. Importantly, the LVO images demonstrate a clear change in shape with the basal and mid lateral segments lagging, suggestive of LCx stenosis. In addition, the mid lateral segment has a perfusion defect which was not present at rest. Subtotal occlusion of the LCx was demonstrated at angiography. [See also additional files 10-23 for entire study].
Figure 8
Figure 8
Use of contrast echo to identify a patient with apical HCM. Note the 'spade shaped LV cavity' on the contrast image [See also additional files 24 and 25]
Figure 9
Figure 9
False positive defects with real-time MCE. Pseudo-apical defects are due to apical bubble destruction (a). Relocation of the focus from the base toward the apex (b) leads to "resolution" of the apical abnormality, but use of a mid-ventricular focus placement may lead to more problems with definition of the basal segments. This case also exemplifies attenuation of the basal lateral segment by contrast within the LV cavity.
Figure 10
Figure 10
Contribution of regional shape changes to the identification of perfusion defects, including irregular wall contour in the apex (a) and mid-inferior segment (b), both associated with subendocardial defects. The C shape of the basal inferior segment complements the diagnosis of a perfusion defect in this segment. (c)
Figure 12
Figure 12
A clear apical defect is evident 2 beats post flash at peak stress (bottom line) which was not evident at rest (top line), consistent with LAD stenosis. [See additional files 26-39 for full case movies, additional file 40 for angiogram and additional file 49 for curve fits].
Figure 13
Figure 13
A basal and mid inferior defect is evident 2 beats post flash at peak stress which was not evident at rest, consistent with RCA stenosis. [See additional files 41-46 for movies and 47 and 48 for angiography].
Figure 14
Figure 14
On the 4CV, an apical and a subendocardial basal infero-septal defect are evident 2 beats post stress. The lateral wall is affected by artefact. On the 2CV, there is hypoperfusion of the inferior wall and subendocardial apical defect on the post stress images. This is consistent with multi-vessel disease.
Figure 15
Figure 15
The raw signal intensity data from the apical septal segment is plotted against time after destruction.
Figure 16
Figure 16
an exponential function curve is applied to allow calculation of A, beta and A*beta.
Figure 17
Figure 17
Resting apical 2-chamber view, 10 beats post-flash, demonstrating absent perfusion to the anterior myocardial wall.

References

    1. Reisner SA, Ong LS, Lichtenberg GS, et al. Myocardial perfusion imaging by contrast echocardiography with use of intracoronary sonicated albumin in humans. J Am Coll Cardiol. 1989;14:660–665. - PubMed
    1. Vandenberg BF, Feinstein SB, Kieso RA, Hunt M, Kerber RE. Myocardial risk area and peak gray level measurement by contrast echocardiography: effect of microbubble size and concentration, injection rate, and coronary vasodilation. Am Heart J. 1988;115:733–739. doi: 10.1016/0002-8703(88)90872-1. - DOI - PubMed
    1. De Jong N, Hoff L. Ultrasound scattering properties of Albunex microspheres. Ultrasonics. 1993;31:175–181. doi: 10.1016/0041-624X(93)90004-J. - DOI - PubMed
    1. Wei K, Skyba DM, Firschke C, Jayaweera AR, Lindner JR, Kaul S. Interactions between microbubbles and ultrasound: in vitro and in vivo observations. J Am Coll Cardiol. 1997;29:1081–1088. doi: 10.1016/S0735-1097(97)00029-6. - DOI - PubMed
    1. Burns PN. Harmonic imaging with ultrasound contrast agents. Clin Radiol. 1996;51:50–55. - PubMed

MeSH terms