

Highly tissue substructure-specific effects of human papilloma virus in mucosa of HIV-infected patients revealed by laser-dissection microscopy-assisted gene expression profiling
- PMID: 15331396
- PMCID: PMC1618607
- DOI: 10.1016/S0002-9440(10)63334-2
Highly tissue substructure-specific effects of human papilloma virus in mucosa of HIV-infected patients revealed by laser-dissection microscopy-assisted gene expression profiling
Abstract
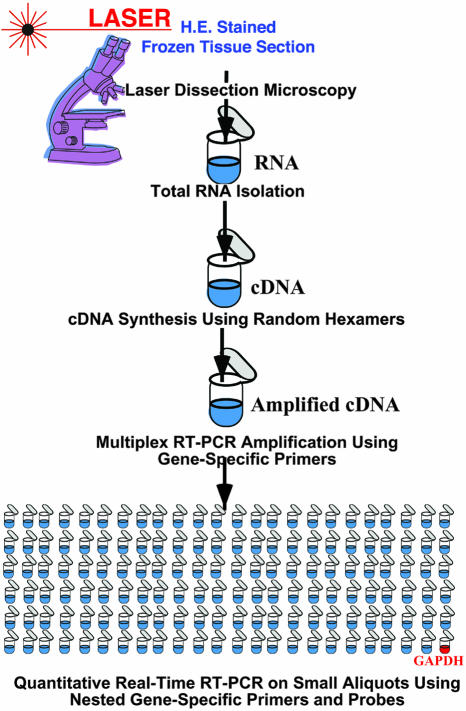
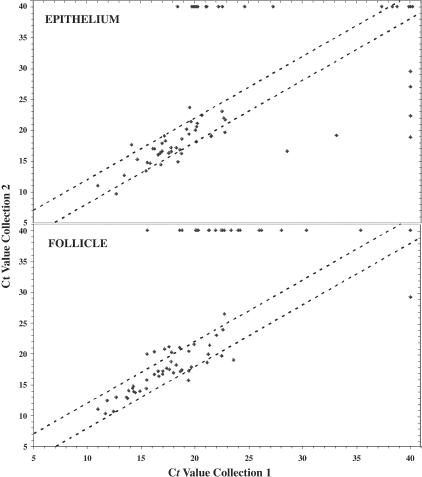
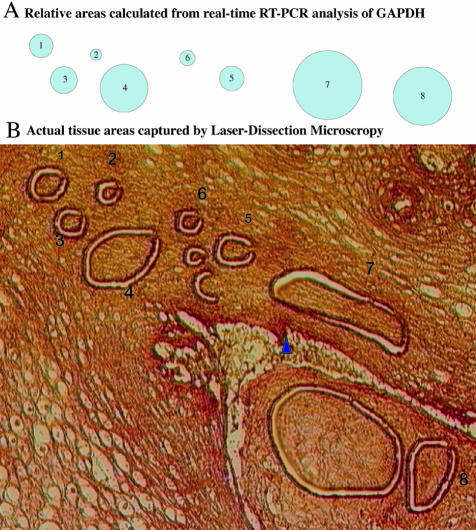
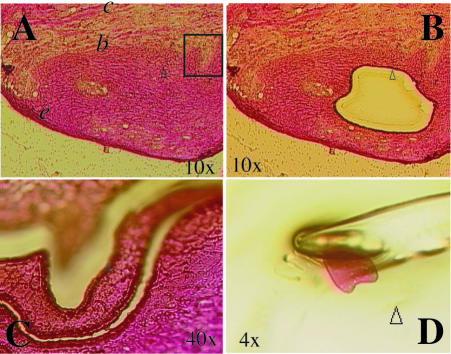
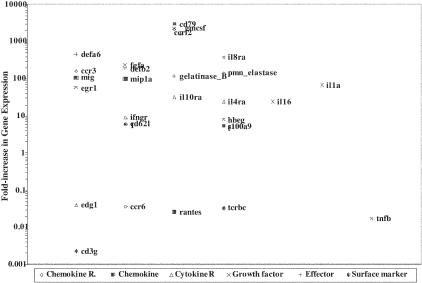
Human papilloma virus (HPV) causes focal infections of epithelial layers in skin and mucosa. HIV-infected patients on highly active antiretroviral therapy (HAART) appear to be at increased risk of developing HPV-induced oral warts. To identify the mechanisms that allow long-term infection of oral epithelial cells in these patients, we used a combination of laser-dissection microscopy (LDM) and highly sensitive and quantitative, non-biased, two-step multiplex real-time RT-PCR to study pathogen-induced alterations of specific tissue subcompartments. Expression of 166 genes was compared in three distinct epithelial and subepithelial compartments isolated from biopsies of normal mucosa from HIV-infected and non-infected patients and of HPV32-induced oral warts from HIV-infected patients. In contrast to the underlying HIV infection and/or HAART, which did not significantly elaborate tissue substructure-specific effects, changes in oral warts were strongly tissue substructure-specific. HPV 32 seems to establish infection by selectively enhancing epithelial cell growth and differentiation in the stratum spinosum and to evade the immune system by actively suppressing inflammatory responses in adjacent underlying tissues. With this highly sensitive and quantitative method tissue-specific expression of hundreds of genes can be studied simultaneously in a few cells. Because of its large dynamic measurement range it could also become a method of choice to confirm and better quantify results obtained by microarray analysis.
Figures
Similar articles
-
[Typing human papilloma virus (HPV) infection in the warts of oral mucosa from HIV-positive patients].Hua Xi Kou Qiang Yi Xue Za Zhi. 2004 Oct;22(5):423-5. Hua Xi Kou Qiang Yi Xue Za Zhi. 2004. PMID: 15562660 Chinese.
-
HPV oral lesions in HIV-infected patients: the impact of long-term HAART.J Oral Pathol Med. 2013 Jul;42(6):443-9. doi: 10.1111/jop.12032. Epub 2012 Dec 20. J Oral Pathol Med. 2013. PMID: 23278731
-
Human papilloma virus type 16 E6 gene expression in oral exophytic epithelial lesions as detected by in situ rtPCR.Oral Surg Oral Med Oral Pathol Oral Radiol Endod. 1999 Feb;87(2):197-208. doi: 10.1016/s1079-2104(99)70273-8. Oral Surg Oral Med Oral Pathol Oral Radiol Endod. 1999. PMID: 10052376
-
HPV-associated oral warts.SADJ. 2011 Mar;66(2):82-5. SADJ. 2011. PMID: 21608502 Review.
-
Role of human papillomaviruses in cutaneous and oral manifestations of immunosuppression.J Acquir Immune Defic Syndr. 1999 Aug 1;21 Suppl 1:S49-57. J Acquir Immune Defic Syndr. 1999. PMID: 10430219 Review.
Cited by
-
Proteomic signatures of human oral epithelial cells in HIV-infected subjects.PLoS One. 2011;6(11):e27816. doi: 10.1371/journal.pone.0027816. Epub 2011 Nov 16. PLoS One. 2011. PMID: 22114700 Free PMC article.
-
HIV: An Epidemiologic study on Head and Neck Involvement in 50 Patients.Iran J Otorhinolaryngol. 2014 Apr;26(75):97-104. Iran J Otorhinolaryngol. 2014. PMID: 24744998 Free PMC article.
-
Oral Human Papillomavirus Infection and Oral Lesions in HIV-Positive and HIV-Negative Dental Patients.J Infect Dis. 2015 Sep 1;212(5):760-8. doi: 10.1093/infdis/jiv080. Epub 2015 Feb 13. J Infect Dis. 2015. PMID: 25681375 Free PMC article.
-
High expression of heat shock protein 10 (Hsp10) is associated with poor prognosis in oral squamous cell carcinoma.Int J Clin Exp Pathol. 2017 Jul 1;10(7):7784-7791. eCollection 2017. Int J Clin Exp Pathol. 2017. PMID: 31966626 Free PMC article.
-
Nicole Baumgarth: tackling flu from a B cell angle. Interviewed by Amy Maxmem.J Exp Med. 2008 Oct 27;205(11):2454-5. doi: 10.1084/jem.20511pi. J Exp Med. 2008. PMID: 18955572 Free PMC article. No abstract available.
References
-
- Schiffman MH, Castle P. Epidemiologic studies of a necessary causal risk factor: human papillomavirus infection and cervical neoplasia. J Natl Cancer Inst. 2003;95:E2. - PubMed
-
- King GN, Healy CM, Glover MT, Kwan JT, Williams DM, Leigh IM, Thornhill MH. Prevalence and risk factors associated with leukoplakia, hairy leukoplakia, erythematous candidiasis, and gingival hyperplasia in renal transplant recipients. Oral Surg Oral Med Oral Pathol. 1994;78:718–726. - PubMed
-
- Coutlee F, Trottier AM, Ghattas G, Leduc R, Toma E, Sanche G, Rodrigues I, Turmel B, Allaire G, Ghadirian P. Risk factors for oral human papillomavirus in adults infected and not infected with human immunodeficiency virus. Sex Transm Dis. 1997;24:23–31. - PubMed
-
- Greenspan D, Canchola AJ, MacPhail LA, Cheikh B, Greenspan JS. Effect of highly active antiretroviral therapy on frequency of oral warts. Lancet. 2001;357:1411–1412. - PubMed
Publication types
MeSH terms
Substances
Grants and funding
LinkOut - more resources
Full Text Sources
Medical
