Comparative Study
. 2005 Jan;93(1):294-304.
doi: 10.1152/jn.00552.2004. Epub 2004 Aug 25.

Membrane bistability in thalamic reticular neurons during spindle oscillations

Affiliations
Comparative Study

Membrane bistability in thalamic reticular neurons during spindle oscillations

Pablo Fuentealba et al. J Neurophysiol. 2005 Jan.

Abstract

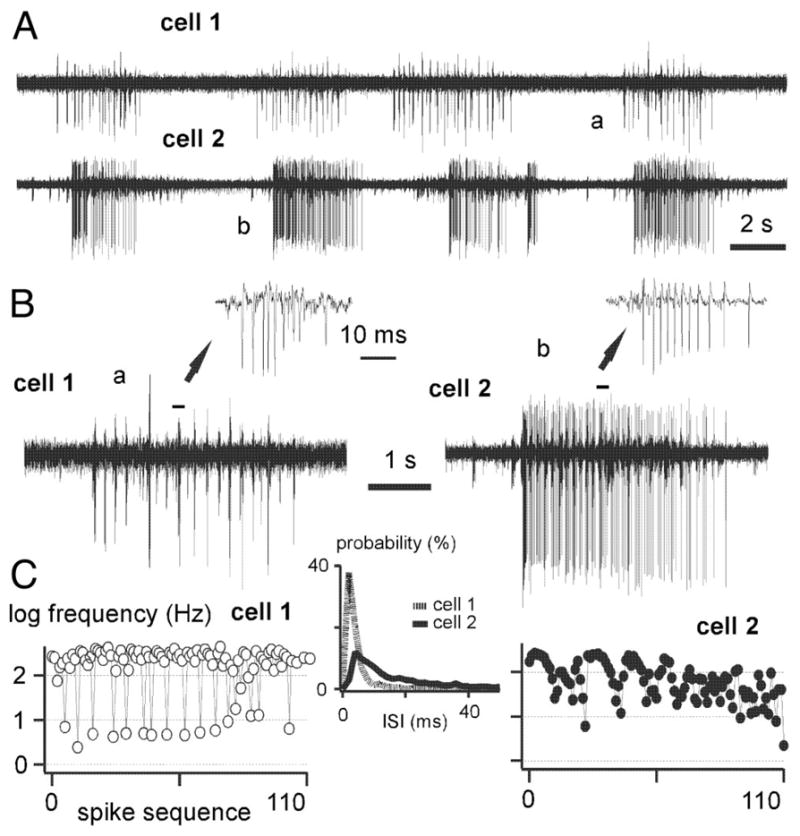
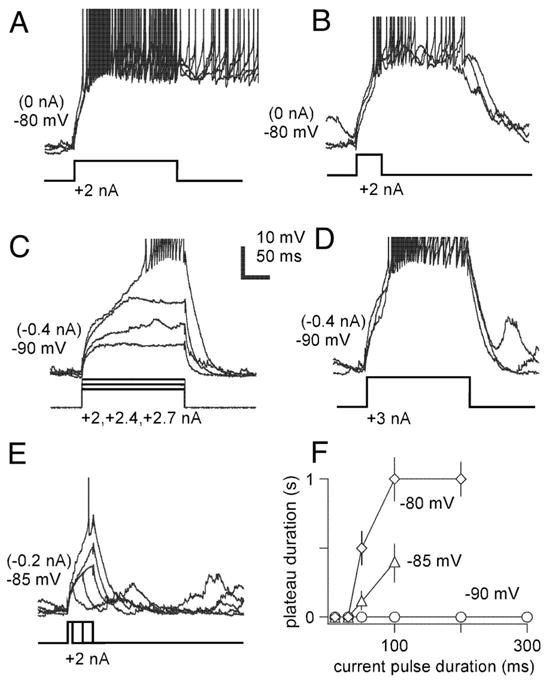
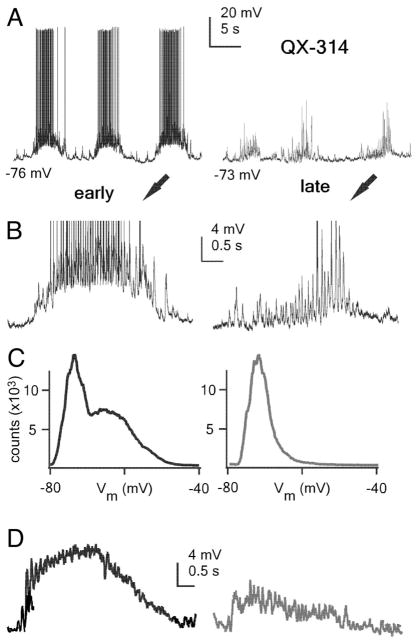
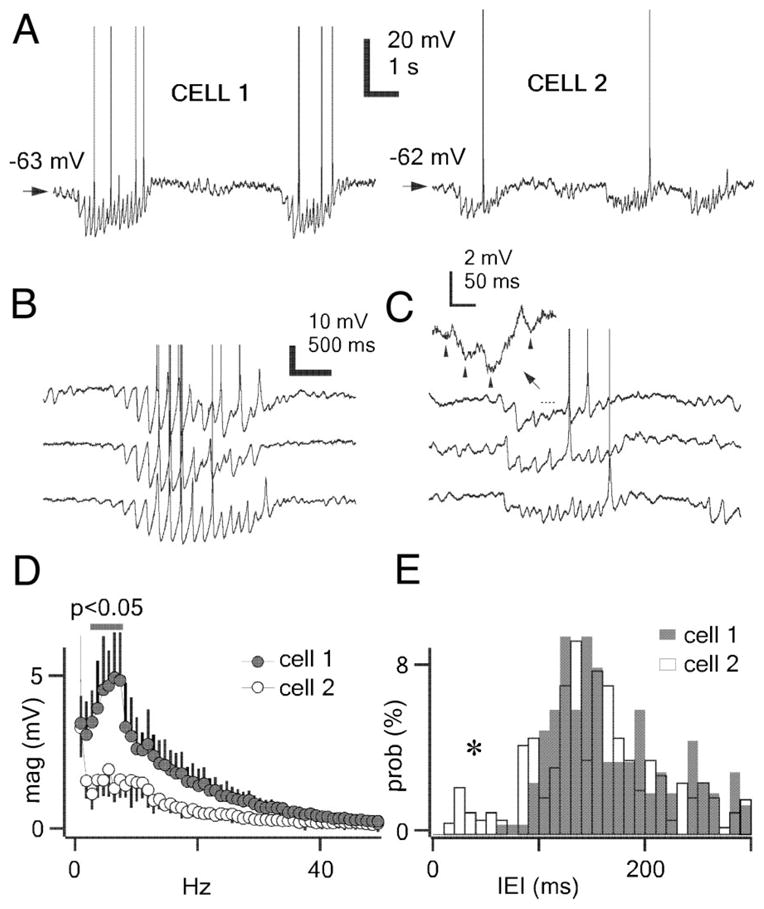
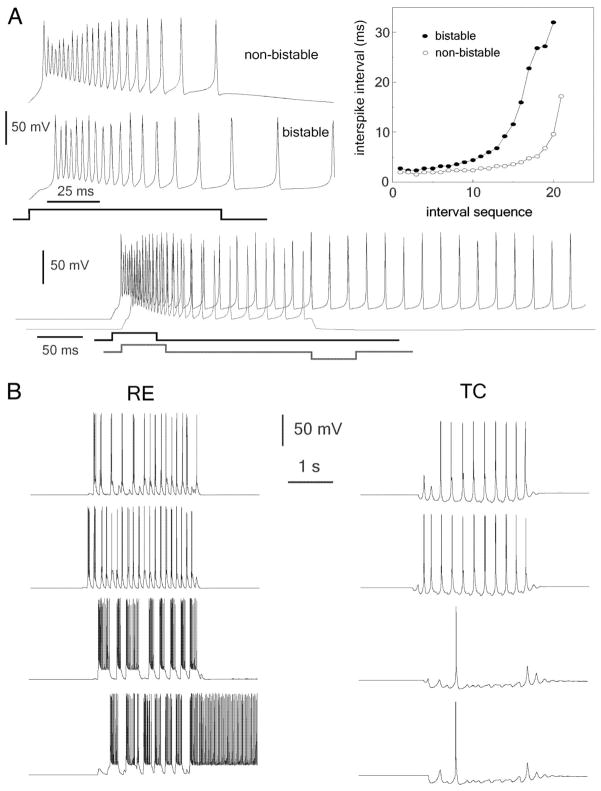
The thalamic reticular (RE) nucleus is a major source of inhibition in the thalamus. It plays a crucial role in regulating the excitability of thalamocortical networks and in generating some sleep rhythms. Current-clamp intracellular recordings of RE neurons in cats under barbiturate anesthesia revealed the presence of membrane bistability in approximately 20% of neurons. Bistability consisted of two alternate membrane potentials, separated by approximately 17-20 mV. While non-bistable (common) RE neurons fired rhythmic spike-bursts during spindles, bistable RE neurons fired tonically, with burst modulation, throughout spindle sequences. Bistability was strongly voltage dependent and only expressed under resting conditions (i.e. no current injection). The transition from the silent to the active state was a regenerative event that could be activated by brief depolarization, whereas brief hyperpolarizations could switch the membrane potential from the active to the silent state. These effects outlasted the current pulses. Corticothalamic stimulation could also switch the membrane potential from silent to active states. Addition of QX-314 in the recording micropipette either abolished or disrupted membrane bistability, suggesting I(Na(p)) to be responsible for its generation. Thalamocortical cells presented various patterns of spindling that reflected the membrane bistability in RE neurons. Finally, experimental data and computer simulations predicted a role for RE neurons' membrane bistability in inducing various patterns of spindling in target thalamocortical cells. We conclude that membrane bistability of RE neurons is an intrinsic property, likely generated by I(Na(p)) and modulated by cortical influences, as well as a factor that determines different patterns of spindle rhythms in thalamocortical neurons.


Figures

FIG. 1
FIG. 1
Membrane bistability in reticular (RE) neurons during spontaneously occurring spindles. A: cortical electroencephalographic (EEG) and intracellular recordings from 2 RE neurons. Typical low-threshold spike bursts of each of these RE cells are expanded in insets; scale is same for both neurons. Bistable neuron displayed sustained depolarizations throughout spindle waves. Non-bistable neuron fired spike bursts, separated by phasic hyperpolarizations, during spindling. Scale bars: 50 ms, 20 mV. B: histograms of Vm distribution from bistable and non-bistable cells in A, taken from a 5-min period of spontaneous activity. Only bistable neurons presented bimodal Vm distributions. Bin size, 1 mV. C: autocorrelograms of action potentials for the same periods used in B. Non-bistable cells discharged in the spindle frequency (~9 Hz), showing clear peaks at ~±110-ms delay, whereas bistable cells showed less marked correlation with spindle frequency. Bin size, 1 ms. D: Bistability is a graded property. Different bistable RE neurons (represented by different gray tones) displayed diverse patterns of Vm distributions, but all showed 2 discrete peaks though at different positions. Note the constancy of the 1st peak (silent) and the variable position of the second peak (active, ↓). Bin size, 1 mV. E: silent and active states during membrane bistability presented different membrane potentials (mean ± SD, n = 9); *P < 0.001. F: intracellularly stained (Neurobiotin) bistable RE neuron located in the rostral sector of the nucleus. Photograph (right) and reconstruction (left). ▲, the axon to the dorsal thalamus. Calibration bar = 20 μm for RE neuron in the photograph and 100 μm for the reconstructed RE neuron. G: microphotograph of the section where the cellular soma was recovered. Reconstruction shows the relative position of the neuron. ▲, rostrolateral sector of the RE nucleus. *, the stimulating electrode in the internal capsule (IC). Scale bar: 500 μm. AV, anteroventral nucleus; CA, caudate nucleus; LV, lateral ventricle; VA, ventroanterior nucleus
FIG. 2
FIG. 2
Membrane bistability can be triggered by corticothalamic inputs. A: intracellular recordings of 2 RE neurons, displaying spindles triggered by electrical stimulation of the internal capsule. One of them presents a plateau potential (bistable), whereas the other neuron shows a typical sequence of spike bursts during spindling. The gray line below both recordings indicates the periods used to compute the histograms in B. B: histograms of Vm distribution during spindle waves from bistable and non-bistable cells in A taken from 50 evoked spindles. Only the bistable neuron presented 2 discrete peaks in the Vm distribution. Bin size, 1 mV. Distributions were significantly different (Kruskal-Wallis, H = 51.5, P < 0.001). C: autocorrelograms of action potentials in both neurons; bin size, 1 ms.
FIG. 3
FIG. 3
Membrane bistability is voltage dependent. Intracellular recording (A–C, left) and histograms of Vm distributions (right) for a RE neuron held at different levels of DC (3-min period of intracellular recording in each case). A: positive current injection (+0.2 nA) depolarized the Vm to −64 mV and caused a sustained, tonic firing (left). Only a single mode was present in such cases for Vm distribution (right). B: without current (0 nA, −79 mV), it was possible to distinguish a bimodal Vm distribution (right). C: negative current injection (−0.2 nA, −90, mV) was equally efficient in abolishing bistability (right) even though firing occurred during spindles (left). D: summary plot of the relation between injected current (DC) and the resulting membrane potential (Vm). The resting level (0 nA) is the only 2 point case in the Vm axis (−79 and −62 mV) and constitutes an asymmetric axis for the apparent input resistance, Rin (7 MΩ for positive DC and 22 MΩ for negative DC). E: summary plot of the relation between injected current (DC) and mean firing frequency of the cell. The resting level marks an asymmetric axis for the gain in firing frequency (56 Hz/nA for positive DC and 10 Hz/nA for negative DC). Rin and gain in firing frequency were calculated as the slope for the linear fitting in D and E, respectively. Each Vm point is the mean of a Gaussian fitting to the histogram for each DC value. Histograms’ bin size, 1 mV.
FIG. 4
FIG. 4
Simultaneous extracellular recordings of non-bistable and bistable RE neurons show different firing patterns during spindles. To avoid corticofugal influences, recordings were made in decorticated cats. A: dual extracellular recordings of RE neurons (cells 1 and 2). B: 1 spindle period chosen from the above panel, for each RE neuron. Visual inspection reveals the presence of tonic firing in cell 2 (right). Spike bursts displaying the accelerando-decelerando pattern identified both RE neurons (see ↑ and insets in B). C: semi-logarithmic plot for firing frequency in cells 1 and 2 during spindle sequences shown in B. Note tonic spikes (~20 –100 Hz) only in cell 2. Inset: interspike intervals for a 5-min period of recording during spontaneous activity in each cell; bin size, 1 ms.
FIG. 5
FIG. 5
Active states in membrane bistability evoked by depolarizing current pulses in RE neurons are graded and voltage dependent. A: current pulse (200 ms, 2 nA) generated an outlasting active state at rest (0 nA). B: shorter current pulses (50 ms, 2 nA) were also able to elicit outlasting active states but of shorter duration. C and D: hyperpolarization (−2 nA), bringing the Vm to −90 mV, abolished the ability of current pulses to generate outlasting active state in the same neuron even though their amplitudes were increased (+2, +2.4, +2.7, and +3 nA). E: very short current pulses (10 and 30 ms) were not able to elicit active responses under slight hyperpolarization (DC −1 nA). Short current pulses (50 ms) could trigger a spike occasionally. F: summary plot for the current pulse duration vs. the duration of the evoked plateau outlasting the stimulus. Note graded properties for intermediate levels of membrane polarization (−85 mV).
FIG. 6
FIG. 6
Intrinsic membrane properties are involved in the generation, maintenance, and termination of active states in membrane bistability. A: depolarizing current pulses (200 ms, +2 nA) were able to generate active states, characteristic of membrane bistability in RE neurons, independent on the duration of the previous silent period (bottom). Note that failures in generating an active state were also independent on the history of the cell. B: hyperpolarizing current pulses (200 ms, −1 and −2 nA) were effective in shunting the active states. Note (bottom) that long-lasting active periods (>3 s) were shunted for longer periods than short lasting (<2 s) active periods; and failures were independent on the ongoing active state duration.
FIG. 7
FIG. 7
Ionic basis of membrane bistability. A: RE neuron recorded with QX-314-filled pipette (50 mM) shown at 2 different periods of recording: early (2 min) and late (40 min). B: expanded period of the recording shown in A. Each period is indicated (→) and corresponds to a complete spindle oscillation. C: Vm distribution for the 2 periods of recording, each histogram computed from a 2-min episode of spontaneous activity. Bin size, 1 mV. D: average (n = 20) of spindle oscillations for the 2 (early and late) periods of recording shows a neat decrease in plateau potentials during the late period. Spikes were removed by filtering digitized signals (<100 Hz).
FIG. 8
FIG. 8
Membrane bistability modulates synaptic responsiveness of RE neurons. A: intracellular recording of RE neuron displaying both silent and active periods as stimulated from the internal capsule (140 μA, 1 Hz). B: superimposed responses (n = 5) during silent states, consisting on short-latency and low-variability excitatory postsynaptic potentials. C: superimposed responses (n = 5) during active states, consisting on short-latency, fixed spikes (▲) and spikes with variable latencies (*). D: summary plot for the stimulation intensity and the probability of evoking and action potential. Note a shift in the curve for active states, which require lower stimulation intensities. Spike probability was calculated as the fraction of stimuli that elicited an action potential.
FIG. 9
FIG. 9
Different spindling patterns in thalamocortical (TC) cells reflect various firing patterns in RE neurons. A: intracellular recordings of 2 TC neurons (VL nucleus) during spindle activity. B and C: 3 different spindle sequences for each of the above cells. Note highly regular activity and early rebound bursting in cell 1. Inset in cell 2 shows 3 inhibitory postsynaptic potentials (IPSPs) (↑) at much higher frequency (~20 Hz) than the usual frequency range of spindles (see text). D: average of frequency spectrums of spindle periods (n = 10, mean ± SD) in both cells 1 and 2 neurons. Bin size, 1 Hz. Note a clear peak around 7 Hz for cell 1. E: histograms of inter-event intervals (IEI) for presumably IPSPs (n = 400) in both cells 1 and 2 during spindle waves. Bin size, 10 ms. Note the presence of a tail at short intervals (<100 ms) for cell 2 (*).
FIG. 10
FIG. 10
Computational models predict that membrane bistability of RE neurons modulates patterns of spindle oscillations in TC neuron. A: single-compartment models of bistable and non-bistable RE neurons. Bistability was obtained by inclusion of INa(p) in non-bistable neurons. Non-bistable gT=3 mS/cm2, INa(p) = 0.3 mS/cm2, bistable gT = 0.75 mS/cm2, gNa(p) = 0.6 mS/cm2 for higher traces; gT=1 mS/cm2, gNa(p) = 0.6 mS/cm2 for lower traces. Resting Vm −80 mV. Right plot reflects interspike intervals for both types of cells, notice non-bistable neurons to fire at higher frequencies. B: RE and TC neurons during active periods in a simulated thalamic network (26 RE cells and 26 TC cells). See also text.

Similar articles

Cited by

References

    1. Alzheimer C, Schwindt PC, Crill WE. Modal gating of Na+ channels as a mechanism of persistent Na+ current in pyramidal neurons from rat and cat sensorimotor cortex. J Neurosci. 1993;13:660–673. - PMC - PubMed
    1. Bal T, von Krosigk M, McCormick DA. Synaptic and membrane mechanisms underlying synchronized oscillations in the ferret lateral geniculate nucleus in vitro. J Physiol. 1995a;483:641–663. - PMC - PubMed
    1. Bal T, von Krosigk M, McCormick DA. Role of the ferret perigeniculate nucleus in the generation of synchronized oscillations in vitro. J Physiol. 1995b;483:665–685. - PMC - PubMed
    1. Bazhenov M, Timofeev I, Steriade M, Sejnowski TJ. Cellular and network models for intrathalamic augmenting responses during 10-Hz stimulation. J Neurophysiol. 1998;79:2730–2748. - PubMed
    1. Bazhenov M, Timofeev I, Steriade M, Sejnowski TJ. Patterns of spiking-bursting activity in the thalamic reticular nucleus initiate sequences of spindle oscillations in thalamic network. J Neurophysiol. 2000;84:1076–1087. - PubMed

Publication types

MeSH terms

LinkOut - more resources