Comparative Study
. 2004 Nov 1;560(Pt 3):737-52.
doi: 10.1113/jphysiol.2004.069294. Epub 2004 Aug 26.

Neuroepithelial oxygen chemoreceptors of the zebrafish gill

Affiliations
Comparative Study

Neuroepithelial oxygen chemoreceptors of the zebrafish gill

Michael G Jonz et al. J Physiol. .

Abstract

In aquatic vertebrates, hypoxia induces physiological changes that arise principally from O(2) chemoreceptors of the gill. Neuroepithelial cells (NECs) of the zebrafish gill are morphologically similar to mammalian O(2) chemoreceptors (e.g. carotid body), suggesting that they may play a role in initiating the hypoxia response in fish. We describe morphological changes of zebrafish gill NECs following in vivo exposure to chronic hypoxia, and characterize the cellular mechanisms of O(2) sensing in isolated NECs using patch-clamp electrophysiology. Confocal immunofluorescence studies indicated that chronic hypoxia (P(O(2)) = 35 mmHg, 60 days) induced hypertrophy, proliferation and process extension in NECs immunoreactive for serotonin or synaptic vesicle protein (SV2). Under voltage clamp, NECs responded to hypoxia (P(O(2)) = 25-140 mmHg) with a dose-dependent decrease in K(+) current. The current-voltage relationship of the O(2)-sensitive current (I(KO(2))) reversed near E(K) and displayed open rectification. Pharmacological characterization indicated that I(KO(2)) was resistant to 20 mM tetraethylammonium (TEA) and 5 mM 4-aminopyridine (4-AP), but was sensitive to 1 mm quinidine. In current-clamp recordings, hypoxia produced membrane depolarization associated with a conductance decrease; this depolarization was blocked by quinidine, but was insensitive to TEA and 4-AP. These biophysical and pharmacological characteristics suggest that hypoxia sensing in zebrafish gill NECs is mediated by inhibition of a background K(+) conductance, which generates a receptor potential necessary for neurosecretion and activation of sensory pathways in the gill. This appears to be a fundamental mechanism of O(2) sensing that arose early in vertebrate evolution, and was adopted later in mammalian O(2) chemoreceptors.


Figures

Figure 1
Figure 1. Simplified illustration of the position of neuroepithelial cells (NECs) within the gill filaments of zebrafish
A, distal section of a single gill filament (F) with perpendicular respiratory lamellae (L). Large arrows indicate the incident flow of water that is diverted by the filament epithelium and flows over the lamellae during ventilation. Small arrows indicate the flow of blood distally through the afferent filament artery (aFA) before oxygenation, and the flow of oxygen-rich blood through the lamellae and efferent filament artery (eFA). B, summary diagram showing the major structures involved in potential O2-sensing pathways of the zebrafish gill. Transverse section of the filament depicted in A showing a NEC residing within the filament epithelium (FE) in close proximity to the respiratory water flow (large arrows) and the eFA. Dashed arrows indicate possible routes through which hypoxia may be detected by NECs. NECs receive innervation from a nerve plexus (NP) arising from the extrinsic nerve bundle (eNB) and from fibres of the intrinsic nerve bundle (iNB). In addition, NECs make contact with intrinsic fibres via neurone-like processes. Based on observations by Jonz & Nurse (2003).
Figure 2
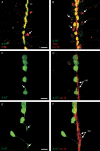
Figure 2. Chronic hypoxia induced hypertrophy, proliferation and process extension in gill neuroepithelial cells (NECs)in vivo
Zebrafish were exposed to either normoxia (control; A, C and D) or chronic hypoxia (B, E and F). NECs were identified by serotonin (5-HT, green) or SV2 (red) immunoreactivity (IR) and nerve fibres were labelled with zn-12. A, in controls, 5-HT-IR and SV2-IR shown together indicated colocalization of both markers in most NECs (yellow) that were arranged in a linear pattern along the filament epithelium (FE), and exposed a population of SV2-IR 5-HT-negative NECs (arrow). Mean NEC area, 44.1 ± 1.6 µm2. Scale bar 20 µm. B, after exposure to chronic hypoxia, 5-HT/SV2-IR NECs of the FE were similar in number and arrangement to those of control in A, but had increased in size. Mean NEC area 59.6 ± 2.4 µm2. In addition, the number of SV2-IR 5-HT-negative NECs (arrows) increased in comparison to normoxic controls. Same magnification as in A. C, 5-HT-IR NECs of the filament epithelium occasionally extended small processes (arrow) in control zebrafish. Scale bar 10 µm. D, same image as in C showing also the close association of NECs with a zn-12-IR intrinsic nerve bundle (iNB). E, in zebrafish exposed to chronic hypoxia, 5-HT-IR NECs extended long neurone-like processes that often terminated with ‘end feet’ (arrows). F, same image as in E showing that process end feet terminated at a zn-12-IR intrinsic nerve bundle (iNB).
Figure 3
Figure 3. Morphometric analysis of neuroepithelial cells (NECs) in gill whole-mount preparations of zebrafish exposed to normoxia or chronic hypoxia
NECs identified by serotonin (5-HT) or SV2 immunoreactivity (IR) were identified and sampled from the distal region of a single filament in fish exposed to normoxia (Nox, n = 25) or chronic hypoxia (CHox, n = 33). A, projection area (µm2) of 5-HT-IR NECs in the gills of zebrafish after exposure. In zebrafish exposed to CHox, NECs were significantly larger than those of controls (t test, *P < 0.005). B, number of 5-HT-IR NECs with processes. The number of 5-HT-IR NECs in the sampled area with neurone-like processes was significantly higher in zebrafish exposed to CHox (t test, *P < 0.001). C, length (µm) of 5-HT-IR NEC processes. Processes of 5-HT-IR NEC from CHox zebrafish were significantly longer than those of normoxic controls (t test, *P < 0.001). D, number of 5-HT-IR (filled bars) and SV2-IR NECs (hatched bars). 5-HT-IR NECs did not significantly increase in number after exposure to CHox (ANOVA-Bonferroni, P > 0.05). However, significantly more SV2-IR NECs were present in gill filaments of CHox zebrafish (n = 23) compared to controls (n = 15, ANOVA-Bonferroni, *P < 0.05), indicating an increase in the number of NECs not immunoreactive for 5-HT. Values are mean ± s.e.m.
Figure 4
Figure 4. Isolation of neuroepithelial cells (NECs) of zebrafish gill filaments
A, bright field image of a NEC (arrow) stained with Neutral Red (NR) 24 h after enzymatic dissociation. Note the typical compartmentalized staining pattern of NR. Other cells were not stained with NR (arrowheads). Scale bar 10 µm. B, phase contrast image of cells in A after fixation. C, the fluorescence image shows that only the NR-positive NEC shown in A and B is immunoreactive for serotonin (5-HT, green). D, images in B and C merged together. E, frequency distribution of the diameter of dissociated gill NECs. Measurement of the diameter of dissociated 5-HT-immunoreactive NECs (n = 372) indicated the presence of two populations, as evidenced by modes at ∼5.1 µm and ∼6.9 µm (dashed lines). Larger NECs of the gill filaments were selected for patch-clamp recording.
Figure 5
Figure 5. Whole-cell, voltage-clamp recording of an O2-sensitive current in isolated neuroepithelial cells (NECs) of the zebrafish gill
A, whole-cell recording from an O2-sensitive NEC showing the current–voltage (IV) relationship during exposure to normoxia (Nox, 150 mmHg), hypoxia (Hox, 25 mmHg) and after recovery in normoxia (Rec). Currents were evoked by changing the voltage from − 100 mV to +50 mV, following a ramp protocol, from a holding potential of −60 mV. IK was variable in these cells (216 ± 74.8 pA at +30 mV, n = 10). Inset, average response of 10 cells to ramp depolarization over a limited range of potentials during normoxia (Nox) and after acute hypoxia (Hox). B, average IV relationship of the O2-sensitive difference current (i.e. Nox – Hox) from 10 cells. The O2-sensitive current (continuous trace) reverses near EK (calculated EK = −83 mV) and is therefore carried predominantly by K+ ions (i.e. IKO2). IKO2 was variable in NECs (58.8 ± 20.2 pA at +30 mV, n = 10). Dashed curve indicates the IV relationship as predicted by the Goldman–Hodgkin–Katz current equation. C, time–series plot of IK inhibition during bath-perfusion with hypoxic solution. Whole-cell currents were evoked every 10 s using voltage steps from −60 mV to +30 mV. Mean ± s.e.m. (n = 8) steady-state current was normalized (left axis) to the average current evoked during the first 60 s (control) of recording and is displayed as a function of time. Changes in PO2 (right axis) in the recording chamber were measured with a carbon fibre electrode (continuous trace) during perfusion with hypoxic solution under identical experimental conditions. IK inhibition began immediately after hypoxic solution was introduced and reached a plateau as the PO2 levelled off near 25 mmHg. Outward current at 25 mmHg was significantly lower than in normoxia (Mann Whitney U test, P < 0.01). Upper traces, examples of whole-cell currents from a single cell before, during and after application of hypoxia. D, relationship between PO2 and IK inhibition by hypoxia in NECs. Data points taken from C during changes in PO2 (25–150 mmHg) are shown with a line of best fit (continuous line). Mean ± s.e.m. IK inhibition was 16.6 ± 2.5% at 25 mmHg. Dashed line shows the hypoxia-induced increase in nerve discharge (normalized; right axis) recorded from sensory fibres of the glossopharyngeal nerve in isolated gill preparations of trout for comparison (modified from Burleson & Milsom, 1993; see Discussion).
Figure 6
Figure 6. IKO2was insensitive to tetraethylammonium (TEA) and 4-aminopyridine (4-AP)
A, typical whole-cell recording from an O2-sensitive NEC showing the persistence of the effects of hypoxia in the presence of 20 mm TEA and 5 mm 4-AP. The cell was held at −60 mV and stepped to +30 mV; current traces are shown for control (Cont), hypoxia (Hox) TEA + 4-AP, and TEA + 4-AP + Hox. B, IV relationship from another O2-sensitive cell similar to A, after steps to a range of potentials. Application of 20 mm TEA and 5 mm 4-AP (•) reduced K+ current relative to control (Cont, ○). Hypoxic inhibition of residual K+ current in the presence of TEA and 4-AP (▪) was observed over a range of test potentials; effects of hypoxia alone omitted for clarity. C, mean ± s.e.m. (n = 5) current density (pA pF−1) of IKO2 (i.e. Nox–Hox) recorded at 0 mV and +30 mV test potentials under control conditions (filled bars, ab in A) and in the presence of 20 mm TEA and 5 mm 4-AP (hatched bars, cd in A). IKO2 was not significantly different in the presence of TEA and 4-AP compared to control at either test potential (paired t test, P > 0.05). Recovery from the effects of TEA plus 4-AP was ∼96% of initial control values at +50 mV (n = 5).
Figure 7
Figure 7. Effects of quinidine onIKO2
A, typical whole-cell recording from an O2-sensitive NEC showing the occlusion of the hypoxia response by 1 mm quinidine (Quid). The cell was held at −60 mV and was stepped to +30 mV. The application of hypoxia (Hox) reduced IK compared to control (Cont). However, hypoxic inhibition of IK was not evident when the experiment was performed in the presence of quinidine (Quid + Hox). B, IV relationship obtained using a ramp protocol from the cell shown in A. Hypoxia (Hox) reduced IK over a range of potentials, but had little effect in the presence of 1 mm quinidine (Quid + Hox). C, average IV relationship of IKO2 from five cells in control (Cont, ab in A and B) and in the presence of 1 mm quinidine (Quid, cd in A and B). D, mean ± s.e.m. (n = 5) current density (pA pF−1) of IKO2 (i.e. Nox–Hox) recorded at −50 mV and 0 mV test potentials under control conditions (Cont, ab in A and B) and in the presence of 1 mm quinidine (Quid, cd in A and B). IKO2 was significantly reduced or abolished (asterisks) at both test potentials in the presence of quinidine (paired t test, P < 0.05). Recovery from the effects quinidine was ∼75% of initial control values at +50 mV (n = 5).
Figure 8
Figure 8. Effects of hypoxia and quinidine on membrane potential (Vm) and input resistance (Rin) in isolated neuroepithelial cells (NECs)
A, typical current-clamp recording of a reversible depolarization of Vm during perfusion (bar) with hypoxic solution (Hox; PO2 = 25 mmHg); resting potential (Vm) was ∼ −50 mV. Injection of 10 pA of hyperpolarizing current for 1 s (downward deflections) evoked a greater change in voltage during hypoxia, indicative of an increase in Rin. B, mean ± s.e.m. (n = 8) Vm of NECs in normoxia (Nox) versus hypoxia (Hox); Vm was significantly, and reversibly, reduced by ∼6 mV in the presence of Hox relative to Nox controls (paired t test, *P < 0.005). C, typical current-clamp recording showing the pronounced depolarization due to application of 1 mm quinidine (Quid) on a cell that was initially at a resting potential of −53 mV; perfusion with hypoxic solution had no effect on Vm in the presence of 1 mm Quid. Dashed line indicates a 6-min pause in recording during recovery. D, current-clamp recording of hypoxic depolarization following administration of 20 mm TEA and 5 mm 4-AP. TEA and 4-AP alone did not change Vm. E, effect of 1 mm quinidine (Quid) on hypoxia-induced depolarization. Mean ± s.e.m. (n = 5) change in membrane potential (ΔVm) in response to hypoxia (Hox) was significantly reduced or eliminated in the presence of Quid (paired t test, *P < 0.05). F, hypoxia-induced changes in Rin (n = 5) are occluded in the presence of quinidine (Quid). Rin was calculated using the equation Rin = ΔV ΔI−1 and the current injection protocol outlined in A. In control (Cont), a significantly greater Rin was observed after perfusion with hypoxic (Hox) solution compared to normoxic (Nox) solution (paired t test, *P < 0.05). The effects of 1 mm Quid increased Rin under normoxic conditions and prevented any further change after addition of the hypoxic perfusate (paired t test, P > 0.05).

Similar articles

Cited by

References

    1. Barrionuevo WR, Burggren WW. O2 consumption and heart rate in developing zebrafish (Danio rerio): influence of temperature and ambient O2. Am J Physiol Regul Integr Comp Physiol. 1999;276:R505–R513. - PubMed
    1. Bisgard GE. Carotid body mechanisms in acclimatization to hypoxia. Respir Physiol. 2000;121:237–246. - PubMed
    1. Bradford CS, Sun L, Collodi P, Barnes DW. Cell cultures from zebrafish embryos and adult tissues. Mol Mar Biol Biotechnol. 1994;3:78–86. - PubMed
    1. Brockerhoff SE, Dowling JE, Hurley JB. Zebrafish retinal mutants. Vision Res. 1998;38:1335–1339. - PubMed
    1. Buckler KJ. A novel oxygen-sensitive potassium current in rat carotid body type I cells. J Physiol. 1997;498:649–662. - PMC - PubMed

Publication types