. 2004 Sep;78(18):10178-86.
doi: 10.1128/JVI.78.18.10178-10186.2004.

During lytic infection herpes simplex virus type 1 is associated with histones bearing modifications that correlate with active transcription

Affiliations

During lytic infection herpes simplex virus type 1 is associated with histones bearing modifications that correlate with active transcription

J R Kent et al. J Virol. 2004 Sep.

Abstract

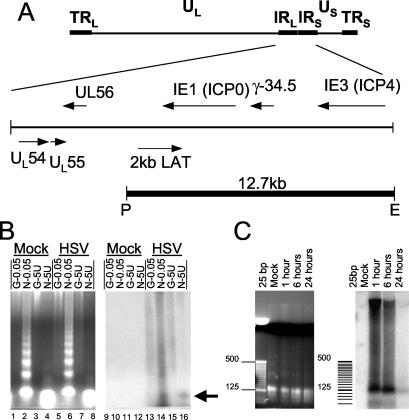
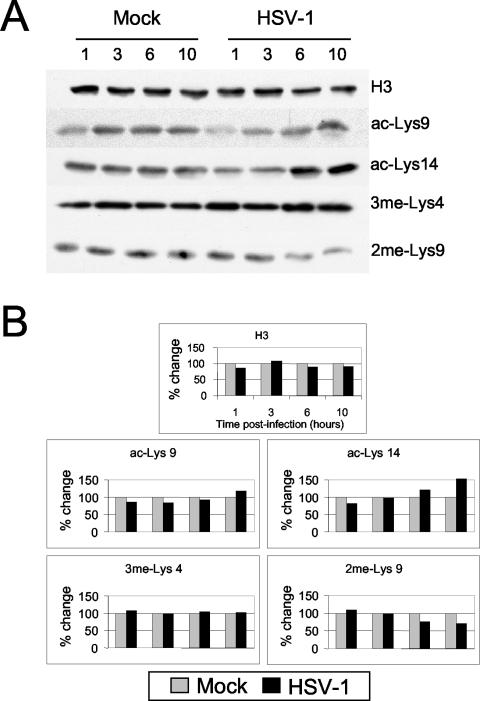
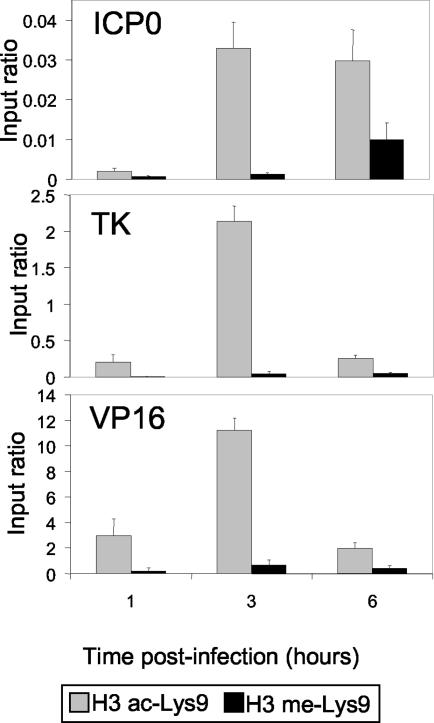
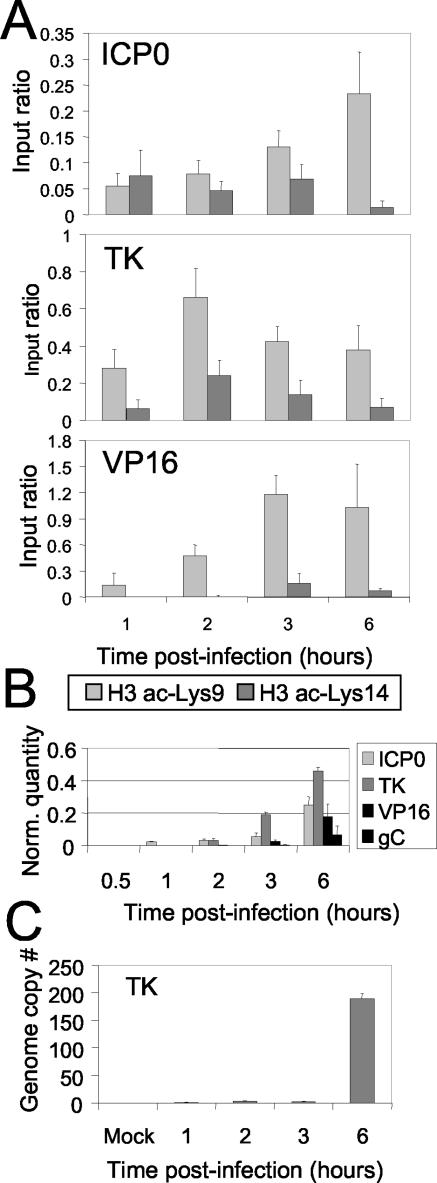
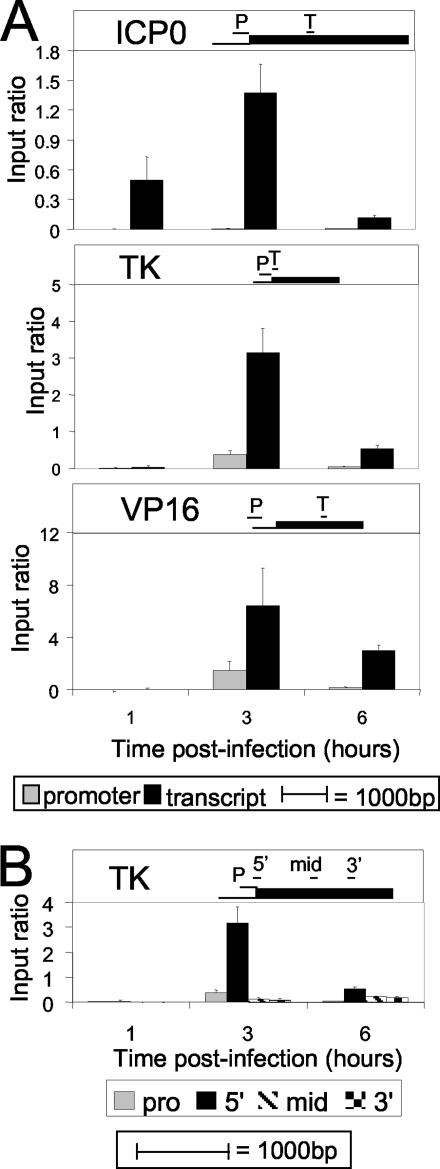
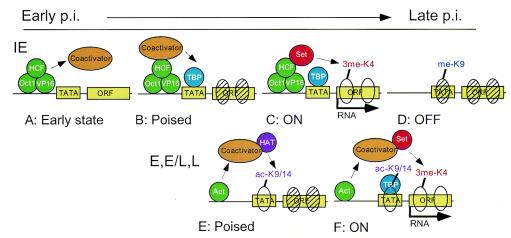
Herpes simplex virus type 1 (HSV-1) is a large (150-kb) double-stranded DNA virus that forms latent infections in neuronal cells of the human peripheral nervous system. Previous work determined that the HSV-1 genome is found in an ordered nucleosomal structure during latent infection. However, during lytic infection, it was unclear whether viral DNA was in a chromatin state. We examined HSV-1 during lytic infection using micrococcal nuclease digestion and chromatin immunoprecipitation. The HSV-1 genome is at least partially nucleosomal, although apparently not in a regular repeating structure. Analysis of histones associated with HSV-1, within both the promoter and the transcribed regions, revealed covalent amino tail modifications similar to those associated with active host mammalian genes. Certain of the modifications were detected in the temporal order expected of the immediate-early, early, and late gene classes. These data suggest that productive infection may be accompanied by acquisition of a permissive chromatin state.


Figures

FIG. 1.
FIG. 1.
MNase digestion of nuclei isolated from Sy5y cells infected with HSV-1. (A) The HSV-1 genome and a detailed analysis of the unique long (UL) and inverted repeat (IR) region, which encompasses several viral genes. The PstI-EcoRI fragment used as a probe in the Southern analysis is marked as a solid line with ends at P and E. TRL, terminal long repeat; TRS, terminal short repeat; LAT, latency-associated transcript. (B) Mock- and HSV-1-infected samples are labeled as genomic DNA (G) and nuclei (N) that are then digested with either 0.05 or 5 U/μl of MNase. The arrow indicates the location of the mononucleosome band. The left panel shows an ethidium bromide-stained agarose gel. The right panel shows the Southern blot probed with the PstI-EcoRI fragment of HSV-1 as shown above. (C) Mock- and HSV-1-infected nuclei isolated at 1, 6, and 24 h p.i. are digested with 5 U/μl of MNase. The left and right panels show an agarose gel and a Southern blot probed as above, respectively. The samples were loaded at 10 times the quantity shown on the agarose gel for the Southern analysis.
FIG. 2.
FIG. 2.
Western blot analysis of total histone proteins present in Sy5y cells during an HSV-1 infection. (A) Sy5y cells were mock infected or infected with HSV-1 and harvested at the times (in hours) p.i. indicated. Antibodies detecting unmodified histone H3 or the covalently modified amino-terminal tail of histone H3 are indicated. Each histone modification was assayed in at least two independent infections with essentially similar results, and a representative experiment is shown. (B) Quantitation of Western blots presented as the percent change of the HSV-1 samples compared to mock-infected samples (set at 100%) at the same time points.
FIG. 3.
FIG. 3.
ChIP analysis of histone H3 associated with viral gene promoter regions during HSV-1 lytic infection of Sy5y cells. Nuclei of infected cells were isolated at various times p.i. as indicated. ChIP assays were performed using ac-Lys9 (gray) or 2me-Lys9 (black) antibodies against the amino-terminal tail of histone H3. The values for ChIP samples at the region of interest as determined by quantitative PCR were normalized to GAPDH and then compared to input values. The gene promoters analyzed were ICP0 (upper panel), TK (middle panel), and VP16 (lower panel).
FIG. 4.
FIG. 4.
ChIP analysis of histone H3 associated with HSV-1 genes compared to transcription during lytic infection. (A) Methods were the same as those described in the legend to Fig. 3. The results of ChIP analysis using antibodies detecting histone H3 modified at ac-Lys9 (light gray) or ac-Lys14 (dark gray) are shown. Genes were the same as those described in the legend to Fig. 3. (B) Quantitative transcriptional analysis by real-time PCR of the four kinetic classes of HSV-1 genes. The genes analyzed were ICP0 (IE), TK (E), VP16 (E/L), and gC (L), as indicated in the key, and primers for each transcript are shown in Table 1. (C) Genome copy numbers of HSV-1 as quantitated by real-time PCR. Total DNA was isolated and analyzed with a standard curve for copies of the TK gene. PCR primers for TK are designated TK 5′ (Table 1).
FIG. 5.
FIG. 5.
ChIP analysis of histone H3 modified at me-K4 within various viral gene regions during infection. (A) Methods were the same as those described in the legend to Fig. 3. The results of ChIP analysis using antibodies detecting histone H3 modified by 3me-Lys4 within three genes are shown. Viral gene-specific primers were used within the promoter and coding regions of ICP0, TK, and VP16, as indicated. Diagrams showing relative primer locations (to scale) within each gene are shown. (B) ChIP analysis of 3me-K4 within the TK promoter and gene. Methods were the same as those described in the legend to Fig. 3, and the same antibody as that used in panel A was used. Primers to TK were within the promoter and the ORF, as indicted.
FIG. 6.
FIG. 6.
Schematic model of transcriptional activation of HSV-1. The upper panel shows an IE gene, such as ICP0, and the lower panel shows an E or E/L gene, such as TK or VP16. Repressed chromatin is represented by hatched ovals (nucleosomes), and permissive chromatin is indicated by open ovals (nucleosomes). TATA-binding protein (TBP) and the TATA box in the proximal promoter are shown. Activators of the IE genes (Oct1, HCF, and VP16) and other activators of the E/L and L genes (Act) are bound to upstream enhancers or promoters. The coactivators are protein complexes that function in recruitment of TBP and histone modifications. HAT represents a histone H3 acetyltransferase, and Set represents a histone H3 methylase. RNA synthesis is indicated by an arrow. Histone-covalent modifications are indicated over the nucleosomes.

References

    1. Asahara, H., B. Santoso, E. Guzman, K. Du, P. A. Cole, I. Davidson, and M. Montminy. 2001. Chromatin-dependent cooperativity between constitutive and inducible activation domains in CREB. Mol. Cell. Biol. 21:7892-7900. - PMC - PubMed
    1. Barlev, N. A., L. Liu, N. H. Chehab, K. Mansfield, K. G. Harris, T. D. Halazonetis, and S. L. Berger. 2001. Acetylation of p53 activates transcription through recruitment of coactivators/histone acetyltransferases. Mol. Cell 8:1243-1254. - PubMed
    1. Berger, S. L. 2002. Histone modifications in transcriptional regulation. Curr. Opin. Genet. Dev. 12:142-148. - PubMed
    1. Bernstein, B. E., E. L. Humphrey, R. L. Erlich, R. Schneider, P. Bouman, J. S. Liu, T. Kouzarides, and S. L. Schreiber. 2002. Methylation of histone H3 Lys 4 in coding regions of active genes. Proc. Natl. Acad. Sci. USA 99:8695-8700. - PMC - PubMed
    1. Boekhoudt, G. H., Z. Guo, G. W. Beresford, and J. M. Boss. 2003. Communication between NF-kappa B and Sp1 controls histone acetylation within the proximal promoter of the monocyte chemoattractant protein 1 gene. J. Immunol. 170:4139-4147. - PubMed

Publication types