

Replacing fats and sweets with vegetables and fruits--a question of cost
- PMID: 15333314
- PMCID: PMC1448493
- DOI: 10.2105/ajph.94.9.1555
Replacing fats and sweets with vegetables and fruits--a question of cost
Abstract
Objectives: We examined the association between diet quality and estimated diet costs.
Methods: Freely chosen diets of 837 French adults were assessed by a dietary history method. Mean national food prices for 57 foods were used to estimate diet costs.
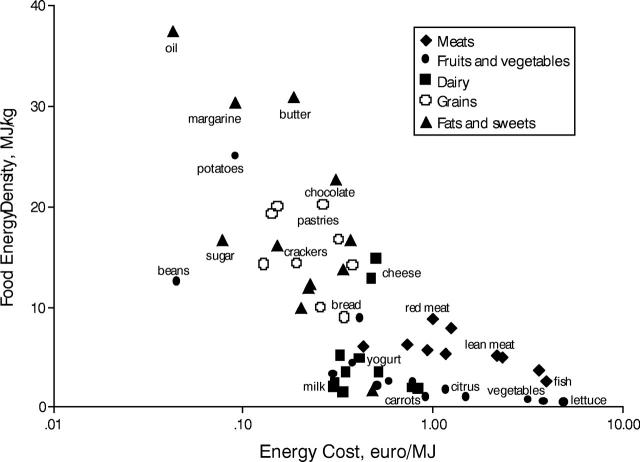
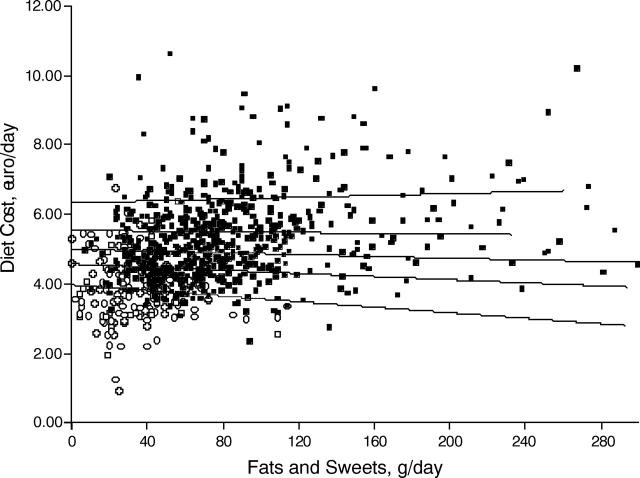
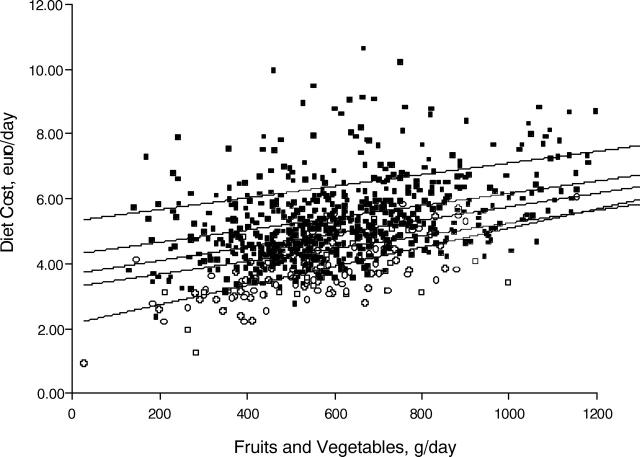
Results: Diets high in fat, sugar, and grains were associated with lower diet costs after adjustment for energy intakes, gender, and age. For most levels of energy intake, each additional 100 g of fats and sweets was associated with a 0.05-0.40 per day reduction in diet costs. In contrast, each additional 100 g of fruit and vegetables was associated with a 0.18-0.29 per day increase in diet costs.
Conclusions: Diets high in fats and sweets represent a low-cost option to the consumer, whereas the recommended "prudent" diets cost more.
Figures
Similar articles
-
Energy-dense diets are associated with lower diet costs: a community study of French adults.Public Health Nutr. 2004 Feb;7(1):21-7. doi: 10.1079/phn2003512. Public Health Nutr. 2004. PMID: 14972068
-
Strategies for intervention: commentary and debate.J Nutr. 2003 Mar;133(3):844S-847S. doi: 10.1093/jn/133.3.844S. J Nutr. 2003. PMID: 12612166 Review.
-
Energy density of foods and diets in Mexico and their monetary cost by socioeconomic strata: analyses of ENSANUT data 2012.J Epidemiol Community Health. 2017 Jul;71(7):713-721. doi: 10.1136/jech-2016-207781. Epub 2017 Apr 6. J Epidemiol Community Health. 2017. PMID: 28385691
-
Food selection associated with sense of coherence in adults.Nutr J. 2005 Feb 28;4:9. doi: 10.1186/1475-2891-4-9. Nutr J. 2005. PMID: 15737236 Free PMC article.
-
Poverty and obesity: the role of energy density and energy costs.Am J Clin Nutr. 2004 Jan;79(1):6-16. doi: 10.1093/ajcn/79.1.6. Am J Clin Nutr. 2004. PMID: 14684391 Review.
Cited by
-
Evaluation of nutritional status of foreign students at King Saud University, Kingdom of Saudi Arabia.Public Health Nutr. 2021 Jan;24(1):43-51. doi: 10.1017/S1368980020002864. Epub 2020 Aug 26. Public Health Nutr. 2021. PMID: 32844736 Free PMC article.
-
The carbohydrate-fat problem: can we construct a healthy diet based on dietary guidelines?Adv Nutr. 2015 May 15;6(3):318S-25S. doi: 10.3945/an.114.006973. Print 2015 May. Adv Nutr. 2015. PMID: 25979505 Free PMC article. Review.
-
The cost of US foods as related to their nutritive value.Am J Clin Nutr. 2010 Nov;92(5):1181-8. doi: 10.3945/ajcn.2010.29300. Epub 2010 Aug 18. Am J Clin Nutr. 2010. PMID: 20720258 Free PMC article.
-
Association between energy density and diet cost in children.Porto Biomed J. 2016 Jul-Aug;1(3):106-111. doi: 10.1016/j.pbj.2016.08.005. Epub 2016 Sep 14. Porto Biomed J. 2016. PMID: 32258558 Free PMC article.
-
Do healthier foods and diet patterns cost more than less healthy options? A systematic review and meta-analysis.BMJ Open. 2013 Dec 5;3(12):e004277. doi: 10.1136/bmjopen-2013-004277. BMJ Open. 2013. PMID: 24309174 Free PMC article.
References
-
- Hu FB, Rimm EB, Stampfer MJ, Ascherio A, Spiegelman D, Willett WC. Prospective study of major dietary patterns and risk of coronary heart disease in men. Am J Clin Nutr. 2000;72:912–921. - PubMed
-
- Joshipura KJ, Hu FB, Manson JE, et al. The effect of fruit and vegetable intake on risk for coronary heart disease. Ann Intern Med. 2001;134:1106–1114. - PubMed
-
- Bazzano LA, He J, Ogden LG, et al. Fruit and vegetable intake and risk of cardiovascular disease in US adult: the first National Health and Nutrition Examination Survey epidemiologic follow-up study. Am J Clin Nutr. 2002;76:93–99. - PubMed
-
- Fung TT, Wilett WC, Stampfer MJ, Nason JE, Hu FB. Dietary patterns and the risk of coronary heart disease in women. Arch Intern Med. 2001;161:1857–1862. - PubMed
-
- Gillman MW, Cupples LA, Gagnon D, et al. Protective effect of fruits and vegetables on development of stroke in men. JAMA. 1995;273:1113–1117. - PubMed
Publication types
MeSH terms
Substances
LinkOut - more resources
Full Text Sources
Other Literature Sources
Medical
