. 2004 Sep;124(3):239-58.
doi: 10.1085/jgp.200409071.

How source content determines intracellular Ca2+ release kinetics. Simultaneous measurement of [Ca2+] transients and [H+] displacement in skeletal muscle

Affiliations

How source content determines intracellular Ca2+ release kinetics. Simultaneous measurement of [Ca2+] transients and [H+] displacement in skeletal muscle

Gonzalo Pizarro et al. J Gen Physiol. 2004 Sep.

Abstract

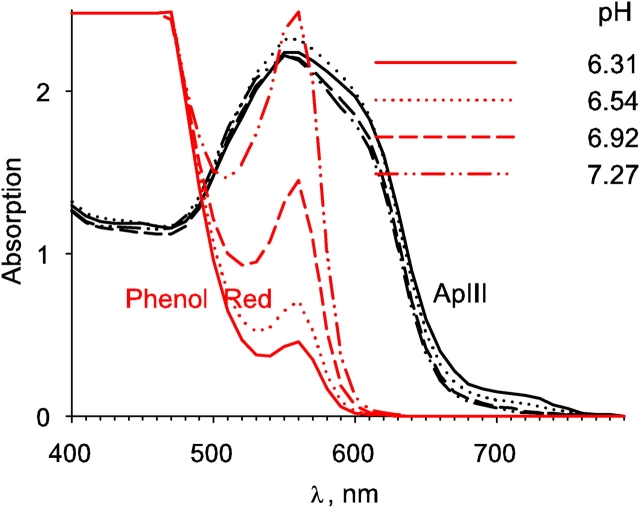
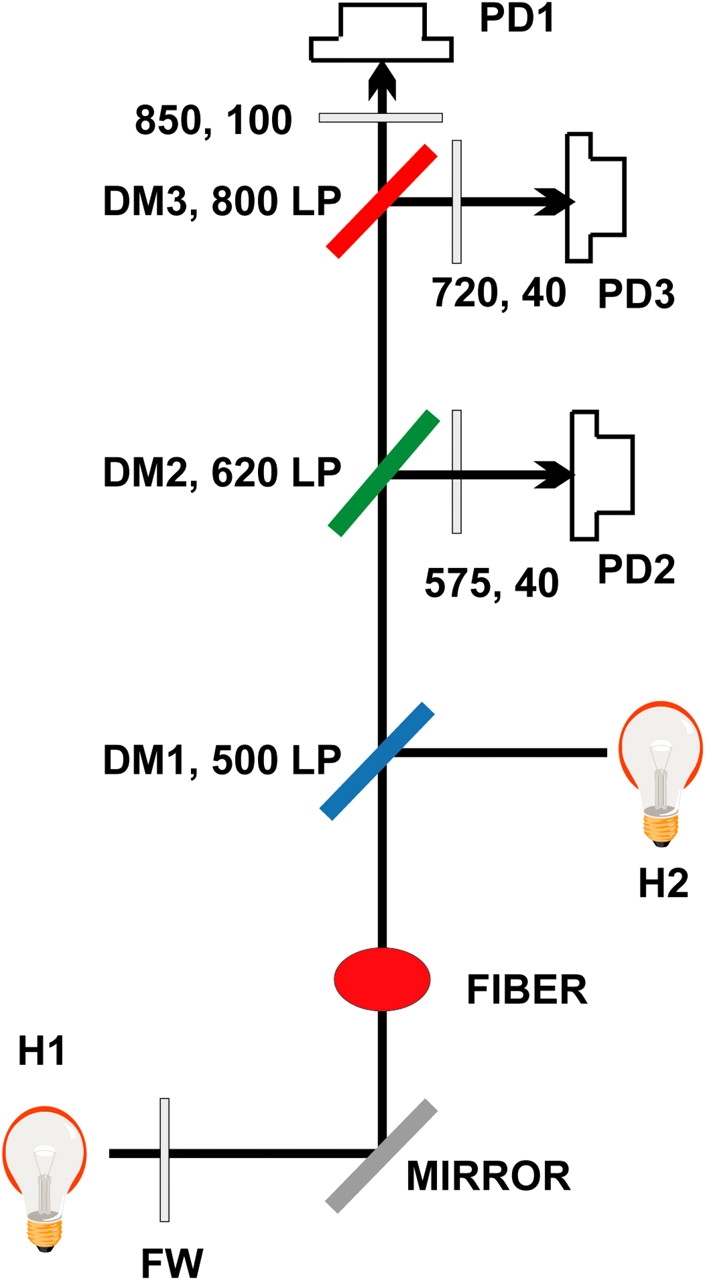
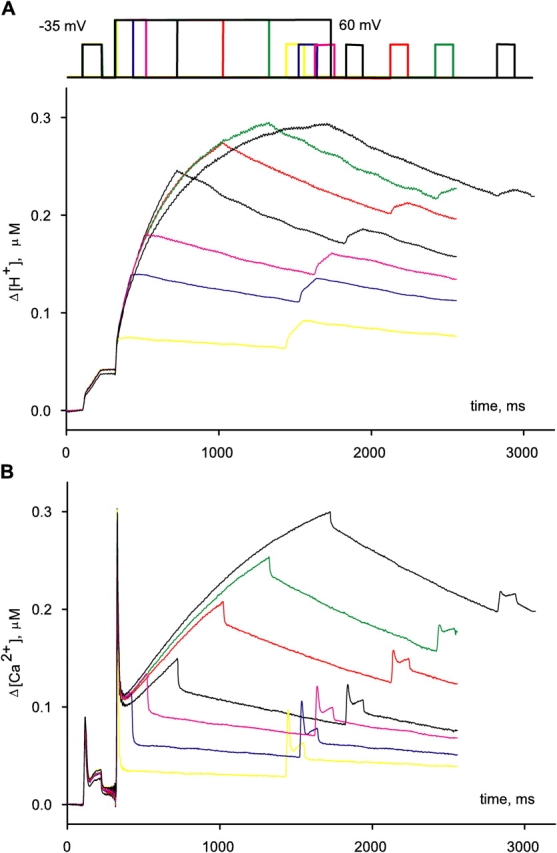
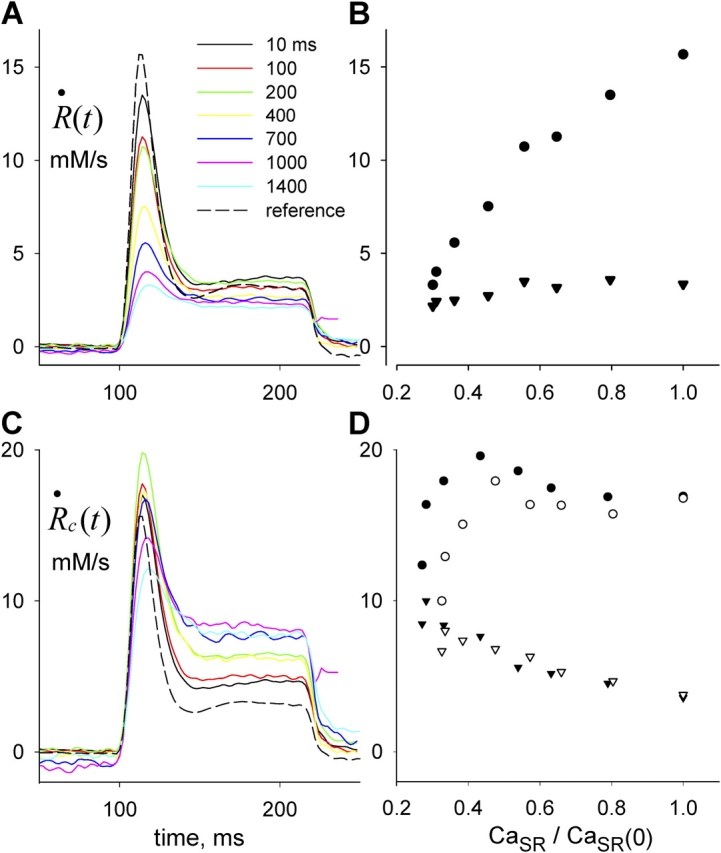
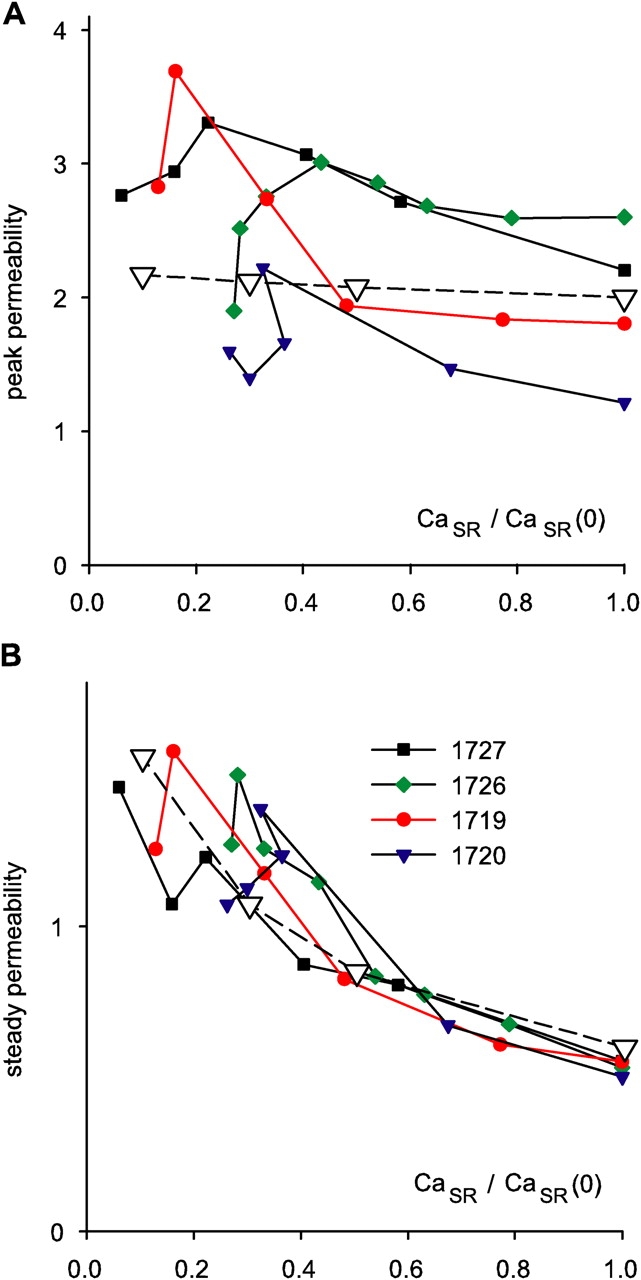
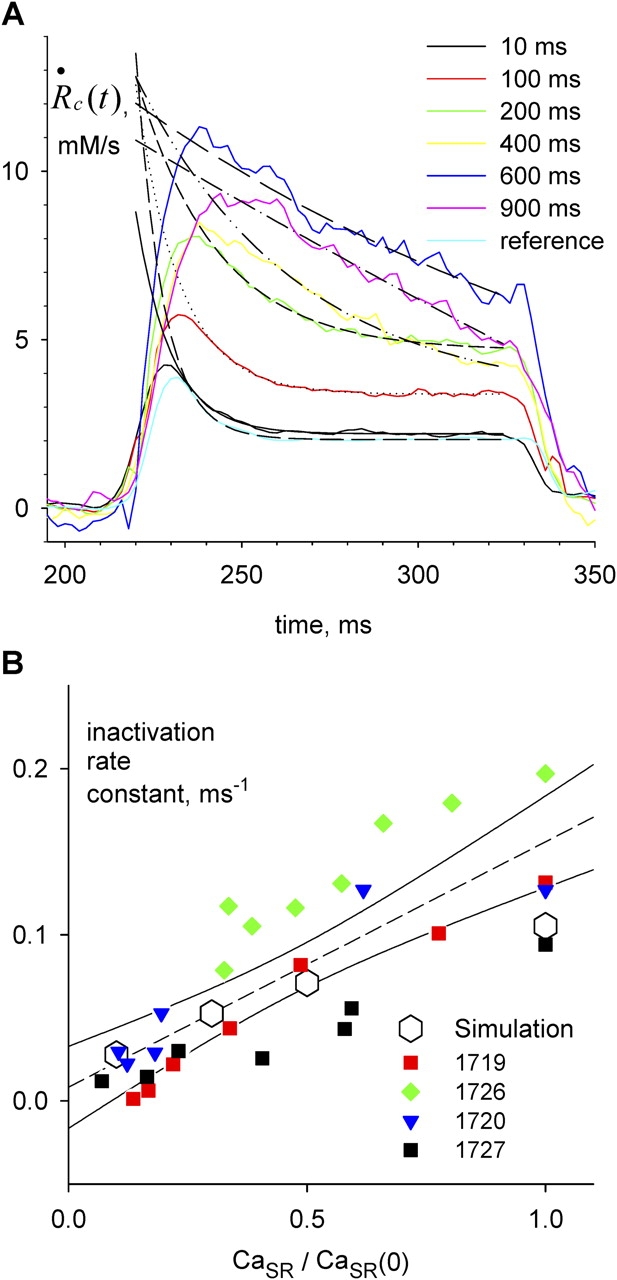
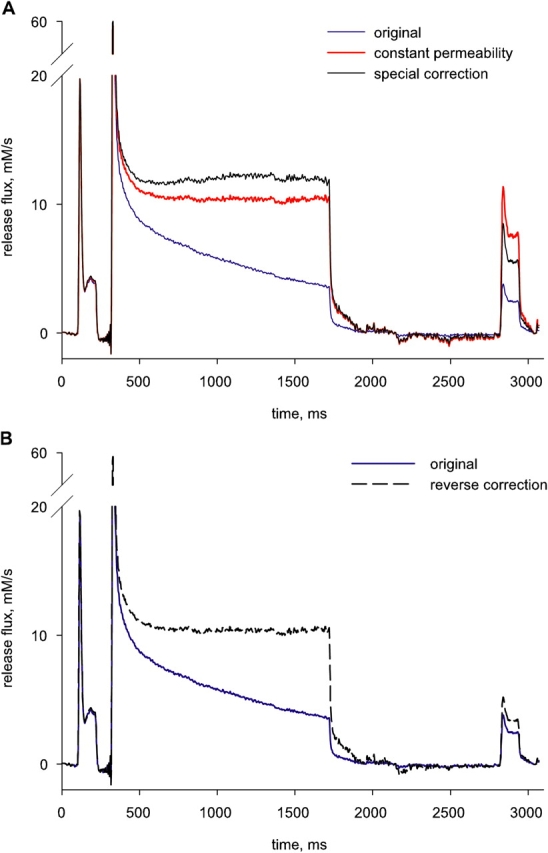
In skeletal muscle, the waveform of Ca(2+) release under clamp depolarization exhibits an early peak. Its decay reflects an inactivation, which locally corresponds to the termination of Ca(2+) sparks, and is crucial for rapid control. In cardiac muscle, both the frequency of spontaneous sparks (i.e., their activation) and their termination appear to be strongly dependent on the Ca(2+) content in the sarcoplasmic reticulum (SR). In skeletal muscle, no such role is established. Seeking a robust measurement of Ca(2+) release and a way to reliably modify the SR content, we combined in the same cells the "EGTA/phenol red" method (Pape et al., 1995) to evaluate Ca(2+) release, with the "removal" method (Melzer et al., 1987) to evaluate release flux. The cytosol of voltage-clamped frog fibers was equilibrated with EGTA (36 mM), antipyrylazo III, and phenol red, and absorbance changes were monitored simultaneously at three wavelengths, affording largely independent evaluations of Delta[H(+)] and Delta[Ca(2+)] from which the amount of released Ca(2+) and the release flux were independently derived. Both methods yielded mutually consistent evaluations of flux. While the removal method gave a better kinetic picture of the release waveform, EGTA/phenol red provided continuous reproducible measures of calcium in the SR (Ca(SR)). Steady release permeability (P), reached at the end of a 120-ms pulse, increased as Ca(SR) was progressively reduced by a prior conditioning pulse, reaching 2.34-fold at 25% of resting Ca(SR) (four cells). Peak P, reached early during a pulse, increased proportionally much less with SR depletion, decreasing at very low Ca(SR). The increase in steady P upon depletion was associated with a slowing of the rate of decay of P after the peak (i.e., a slower inactivation of Ca(2+) release). These results are consistent with a major inhibitory effect of cytosolic (rather than intra-SR) Ca(2+) on the activity of Ca(2+) release channels.


Figures

F<sc>igure</sc> 1.
Figure 1.
Absorption spectra of phenol red and ApIII at various pH. The figure graphs absorption spectra of intracellular solutions containing 2 mM phenol red (red trace) or 0.88 mM ApIII measured in a 0.1-cm cuvette. Note lack of sensitivity of ApIII absorption to pH.
F<sc>igure</sc> 2.
Figure 2.
Photometric system. H1, halogen source for transmitted light. FW, filter wheel, with 550 nm long-pass filter for dynamic measurements and band-pass filters at 480 nm (20 nm bandwidth), 575 nm (40), and 620 nm (40) for static evaluation of dye concentrations. Fiber is mounted at stage of upright microscope. Transmitted light is collected by a 40× objective. Halogen or arc lamp source H2, and dichroic mirror DM1 are used for alternative epifluorescence, and withdrawn in most cases. DM2 reflects light of λ < 620 nm, further filtered at 575 nm (40), to photodiode 2. This light largely carries phenol red (H+) signals. DM3 reflects light of λ < 800 nm, further filtered at 720 nm (40), into photodiode 3. This light carries ApIII (Ca2+) signals. The transmitted light, further filtered at 850 nm (100) goes to photodiode 1. It carries intrinsic signals. For static measurements of dye concentration, no filters or mirrors are interposed in the path of transmitted light, which is measured directly by PD1.
F<sc>igure</sc> 3.
Figure 3.
Evolution of dye and H+ concentrations in the working fiber segment. Time was measured from the moment of permeabilization of cut fiber ends, when fiber was first exposed to internal solution containing ApIII (0.8 mM) and phenol red (1.25 mM). [ApIII] and [phenol red] were derived from resting absorbances at 480 and 620 nm (Eq. 1). [H+] from measurements at 575 nm. Dashed lines mark the interval during which the depletion pulse pattern was applied. Identifier 1726.
F<sc>igure</sc> 4.
Figure 4.
Initial analysis of optical records. (A) Changes in transmitted light intensity. I, simultaneously measured at three wavelengths as indicated. (B) Dye-related changes in absorbance at 575 and 720 nm, derived from intensities in A. Record ΔA Ap(720) is derived (according to Eq. 4) by linear combination of ΔA(720) and ΔA intrinsic(720), which in turn is derived from ΔI(550), blue in A, and I(550). ΔA PR(575) (dashed) is derived according to Eq. 6, by linear combination of A(575), A Ap(575), and A intrinsic(575) (in turn evaluated by Eq. 5). A Ap(575) is calculated as the sum of a resting component (second term, right hand side of Eq. 2) and a change ΔA Ap(575), derived by scaling ΔA Ap(720) by 0.25. The record in red, continuous trace, is ΔA(575) after correction for the intrinsic absorbance change (i.e., the total change in absorbance due to both dyes). It is very similar to ΔA PR(575), which stresses that the interference between the two dyes is almost negligible. Identifier 1723, vertical diameter = 73 μm, [phenol red]= 2.20 mM, [ApIII]= 0.86 mM, pH 6.35.
F<sc>igure</sc> 5.
Figure 5.
Simultaneously measured Δ[H+](t) and Δ[Ca2+](t). Pulse patterns are represented schematically at top. Different applications, and the corresponding records, are identified by different colors. Pulse protocols consisted of a reference to −35 mV, a conditioning or depleting pulse to 60 mV, of variable duration, and a test, identical to the reference pulse, which followed 1,100 ms after the conditioning pulse. (A) Δ[H+](t), obtained by shifting [H+](t) determined according to Eq. 3. (B) Δ[Ca2+](t), derived from ΔA Ap(720). Identifier 1726, [ApIII] ranged between 0.71 and 1.05 mM. [phenol red], 2.63–3.16 mM. pH 6.65–6.48.
F<sc>igure</sc> 6.
Figure 6.
Two estimates of Ca2+ release flux. (A) d[H+]/dt derived from [H+](t) in Fig. 5. (B) Release flux formula imaget formula imageobtained from the color matching Δ[Ca2+](t) in Fig. 5 by the removal method. In all experiments, the following parameters of the removal model remained constant at the values given: k on Ca Trop = 125 μ M−1 s−1, k off Ca Trop = 1,200 s−1, k on Ca Parv = 100 μ M−1 s−1, k on Mg Parv = 0.03 μ M−1 s−1, k off Ca Parv = 1 s−1, k off Mg Parv = 1.73 s−1, [pump Ca2+ binding sites] = 100 μM, [troponin] = 240 μM. The other parameters were fitted. Their values in the present case: [EGTA] = 40 mM, [Parvalbumin] = 2 mM, k on Ca EGTA = 5.34 μ M−1 s−1, k off Ca EGTA = 7 s−1, maximum pump rate = 5.3 mM/s, pump dissociation constant for Ca2+ binding = 0.2 μ M. The pump flux was proportional to the second power of the occupation of its Ca2+-binding sites. The flux onto or from ApIII was derived from the rate of change of [Ca ApIII2].
F<sc>igure</sc> 7.
Figure 7.
Correction of release flux for the change in SR Ca content. (A) Δ[H+](t) for the 1,400 ms depleting pulse of the series in Fig. 5. Dashed line, single exponential fit to the record (Eq. 14), from t 0 = 410 ms (50 ms into the pulse) to the end of the depleting pulse, with Δ[H+](t 0) = 0.1219, Δ[H+]max = 0.301, and τ = 0.417 s−1. (α/2)Δ[H+]max is the main term in the quantification of initial SR content (Eq. A3). (B) Release waveform formula imaget formula image (dashed), and formula image c formula image t formula imagecalculated according to Eq. A5 (solid). Identifier 1726.
F<sc>igure</sc> 8.
Figure 8.
Release permeability changes with SR depletion. (A) Test release flux formula imaget formula image following depleting pulses of various durations, as indicated. (B) Peak (circles) or steady value of level of formula imaget formula image, vs. CaSR normalized to its resting value. While the peak release flux is roughly proportional to CaSR, the steady value is nearly constant, indicating increase in steady permeability. (C) Corresponding formula image c formula image t formula image, corrected according to Eq. 13 (“first approximation”). (D) Peak or steady values of formula image c formula image t formula image, corrected according to Eq. 13 (filled) or Eq. A5 (open symbols). Both corrections yield qualitatively similar dependences. Identifier 1726.
F<sc>igure</sc> 9.
Figure 9.
Release permeability and SR content. Peak (A) and steady (B) formula image c formula image t formula image for different degrees of depletion, vs. normalized CaSR. Different symbols represent different experiments. Points are connected by lines in monotonic order of conditioning durations. Correction procedure performed with the lower estimate of SR content (Eq. 15). Peak and steady values of individual experiments were normalized to the average steady value in all realizations of the same experiment. The ordinate is therefore permeability (peak or steady) normalized to average steady permeability. The open symbols plot the outcome of a simulation with the model described in discussion (Eqs. 18, 20, and 22). The simulation generated time courses during a test depolarization to −45 mV at varying degrees of depletion. The activation variable x (Eq. 18) had transition voltage −40 mV, steepness factor 10 mV, and activation rate constant 0.02 ms−1 at the transition voltage. n was set to 8. In Eq. 20, k f was 1.33 ms−1, k r was 0.01 ms−1, and K/c 1 was 0.25 for the fully loaded SR, and then scaled in inverse proportion to load, at CaSR = 50%, 30%, and 10% of CaSR(0).
F<sc>igure</sc> 10.
Figure 10.
SR depletion slows inactivation. (A) formula image c formula image t formula image transients elicited by test pulses, color coded to conditioning pulse durations. In black traces are superimposed single exponentials, fitted from the beginning of the region with positive curvature, as judged by eye, to the end of the test pulse. Fitted exponential rate constants are plotted vs. fractional SR content in B (red squares). The regression line through these points (not shown) has slope 0.149 ms−1, intercept −0.011 ms−1, and r 2 0.959. Identifier 1719. Removal model parameters had the same values as ID 1726, listed in legend of Fig. 6, except the following, which were adjusted for best fit: [EGTA] = 30 mM, [Parvalbumin] = 1 mM, k on Ca EGTA = 5.00 μ M−1 s−1, k off Ca EGTA = 5.00 s−1, maximum pump rate = 10 mM/s, pump dissociation constant for Ca2+ binding = 1.0 μ M. (B) Rate constants from all experiments in Fig. 9 plotted vs. fractional SR content. The dashed line is the linear regression through all the data in the plot, with slope 0.147 ms−1, intercept 0.008 ms−1, and r2 0.639. Open symbols represent rate constants of exponential fits to permeability transients simulated with the model described in discussion, using parameter values given in the legend of Fig. 9.
F<sc>igure</sc> 11.
Figure 11.
Changes in intramembranous charge transfer accompanying SR depletion. (A) Intramembranous charge movement currents elicited by the reference pulse to −35 mV (black), or by test pulses to the same voltage, after depleting pulses of 10 ms or 1.4 s. Due to the long conditioning duration, the third record was terminated before completion of the OFF charge movement. (B) Corresponding charge transfer (time integrals Q(t)). (C) “Transfer function,” steady release flux measured from rest (i.e., full SR load) and corrected for depletion vs. Q(V) at the end of a pulse to voltage V. The two dashed vertical lines mark Q(−35 mV) transferred by the reference pulse or the test pulse after depletion. The corresponding values of release flux at these levels of charge are indicated by dashed horizontal lines, which are separated (as shown in the inset with expanded scales) by 26% of the lower value. Release flux should therefore increase by 26% due to the increase in Q. Identifier 1726.
F<sc>igure</sc> 12.
Figure 12.
The “constant permeability” correction. (A) Blue trace: formula imaget formula image, same as in Fig. 7 B. Red: formula image c formula image t formula image, calculated according to Eq. 16. The choice of the value 14.5 mM for CaSR(0) led to a nearly constant corrected level during late portions of the conditioning pulse. Black: correction according to Eq. 17, with CaSR(0) = 11.5 mM and pump flux computed from the removal model, with best fit parameters given in the legend of Fig. 6. (B) Blue trace: formula imaget formula image, repeated from A. “Reverse correction” (black dashed) is obtained with Eq. 17, by increasing the term “pump flux” during the interval between conditioning and test, which increases the denominator in Eq. 17, until the corrected test release flux reaches the same steady level as the reference release flux (in accordance with the constant permeability hypothesis). An implausibly large 67% of the amount released during the conditioning pulse must return in order to reach this level.
(SCHEME 1)
(SCHEME 1)
F<sc>igure</sc> 13.
Figure 13.
Ca2+ remnant in the SR after the longest pulses. (A) Time derivative of Δ[H+](t) from the record in Fig. 7 A. Inset is same record at an expanded scale, to illustrate evolution at end of conditioning pulse. Horizontal bar in inset plots (d[H+]/dt)off, average over 100 ms following the end of the conditioning pulse. This value is used in Eqs. A2–A5. (B) Two estimates of CaSR(t). Black trace: (α/2)CaSR(t) according to Eq. 15. Red: (α/2)CaSR(t) according to Eq. A4. The estimates of CaSR(t) differ by a constant, the remnant CaSR(∞). (C) Release flux and its correction. Blue trace: formula imaget formula image calculated by the removal method (same record as in Fig. 7 B). Black: formula image c formula image t formula image, derived from formula imaget formula image by Eq. 13 (the “first approximation”). Red: formula image c formula image t formula image from Eq. A5 (the “full correction”). Note that the two corrected records differ greatly at the end of the conditioning pulse, but not so during the test pulse. Identifier 1726.

References

    1. Baylor, S.M., and S. Hollingworth. 1988. Fura-2 calcium transients in frog skeletal muscle fibres. J. Physiol. 403:151–192. - PMC - PubMed
    1. Baylor, S.M., and S. Hollingworth. 1990. Absorbance signals from resting frog skeletal muscle fibers injected with the pH indicator dye, phenol red. J. Gen. Physiol. 96:449–471. - PMC - PubMed
    1. Baylor, S.M., W.K. Chandler, and M.W. Marshall. 1983. Sarcoplasmic reticulum calcium release in frog skeletal muscle fibres estimated from Arsenazo III calcium transients. J. Physiol. 344:625–666. - PMC - PubMed
    1. Brum, G., and E. Ríos. 1987. Intramembrane charge movement in frog skeletal muscle fibres. Properties of charge 2. J. Physiol. 387:489–517. - PMC - PubMed
    1. Brum, G., R. Fitts, G. Pizarro, and E. Ríos. 1988. Voltage sensors of the frog skeletal muscle membrane require calcium to function in excitation-contraction coupling. J. Physiol. 398:475–505. - PMC - PubMed

Publication types