. 2004 Nov;87(5):3525-35.
doi: 10.1529/biophysj.104.046383. Epub 2004 Aug 31.

Near-field scanning fluorescence microscopy study of ion channel clusters in cardiac myocyte membranes

Affiliations

Near-field scanning fluorescence microscopy study of ion channel clusters in cardiac myocyte membranes

Anatoli Ianoul et al. Biophys J. 2004 Nov.

Abstract

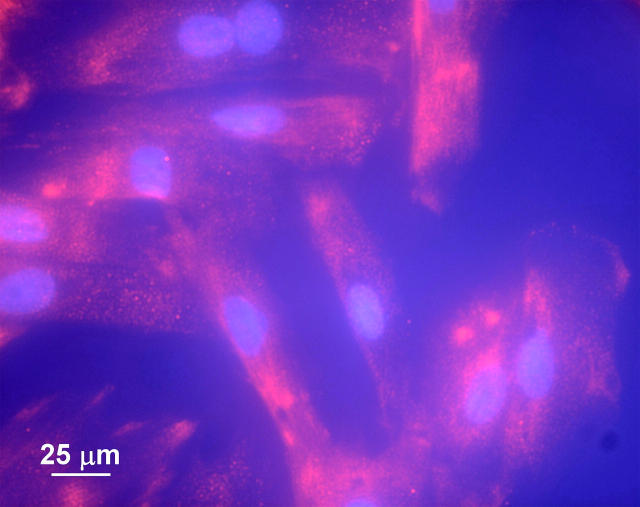
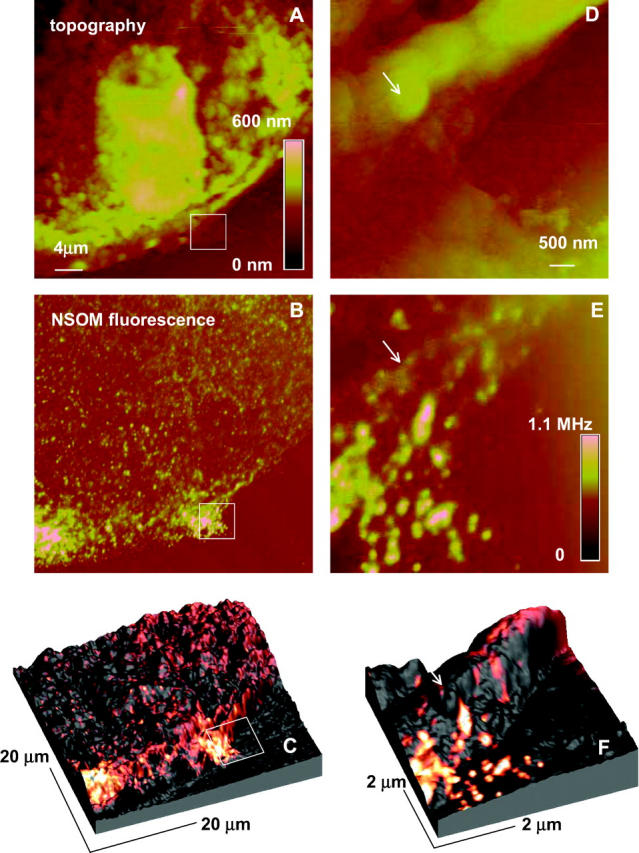
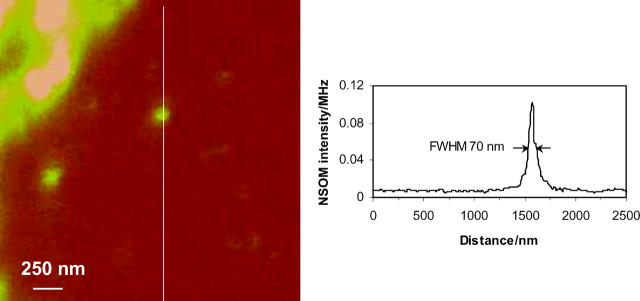
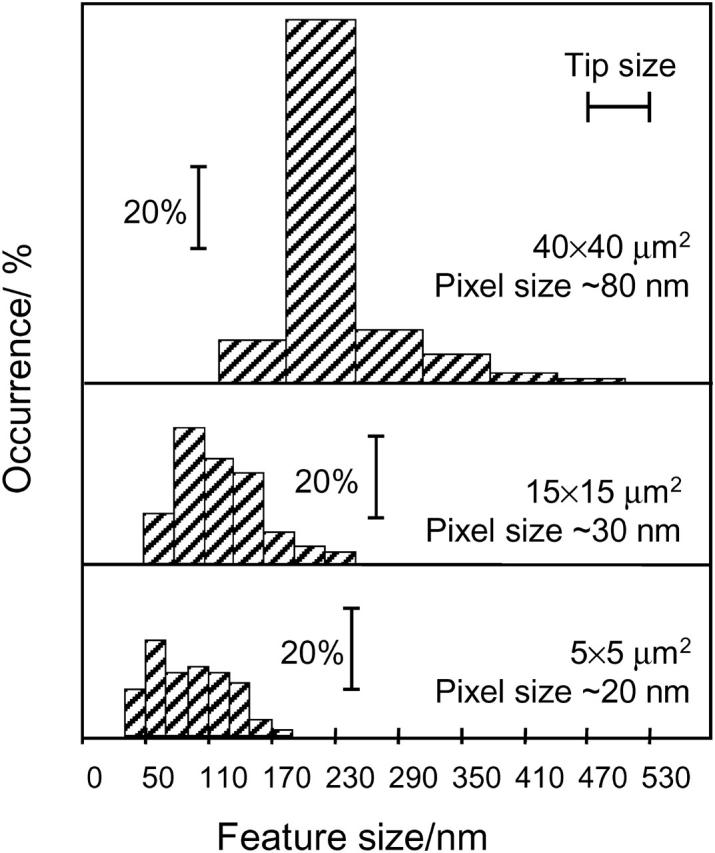
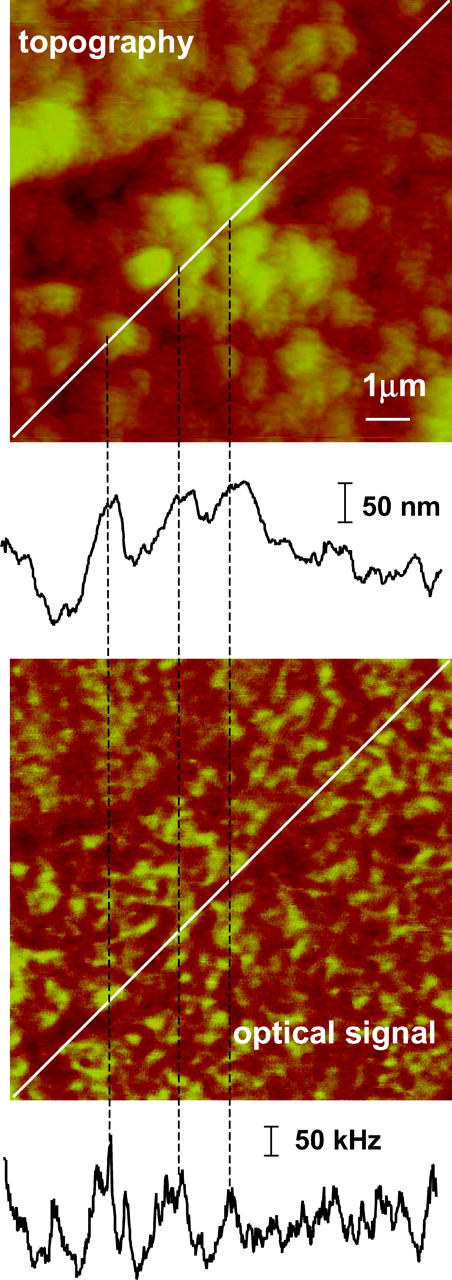
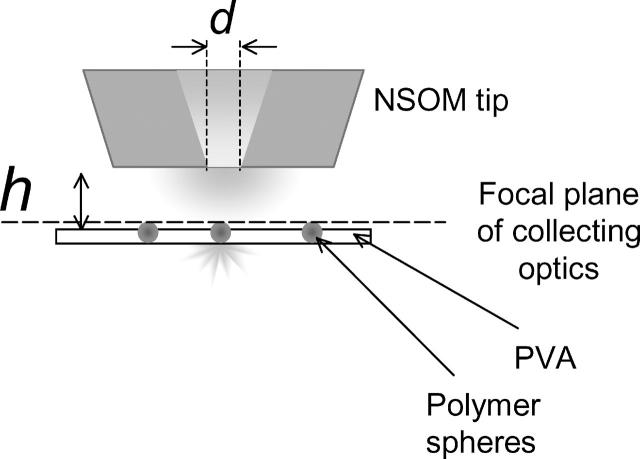
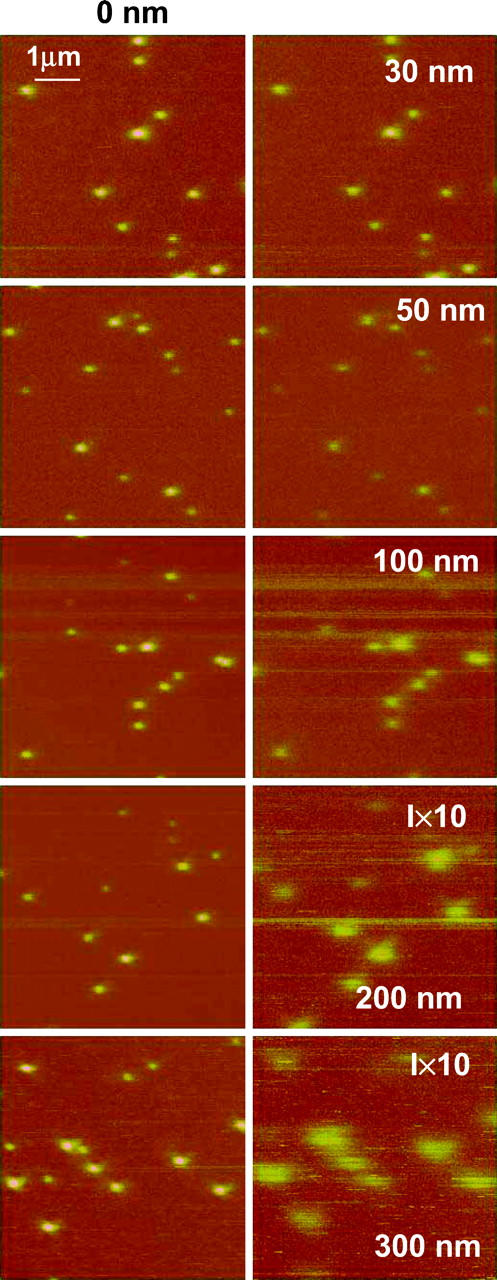
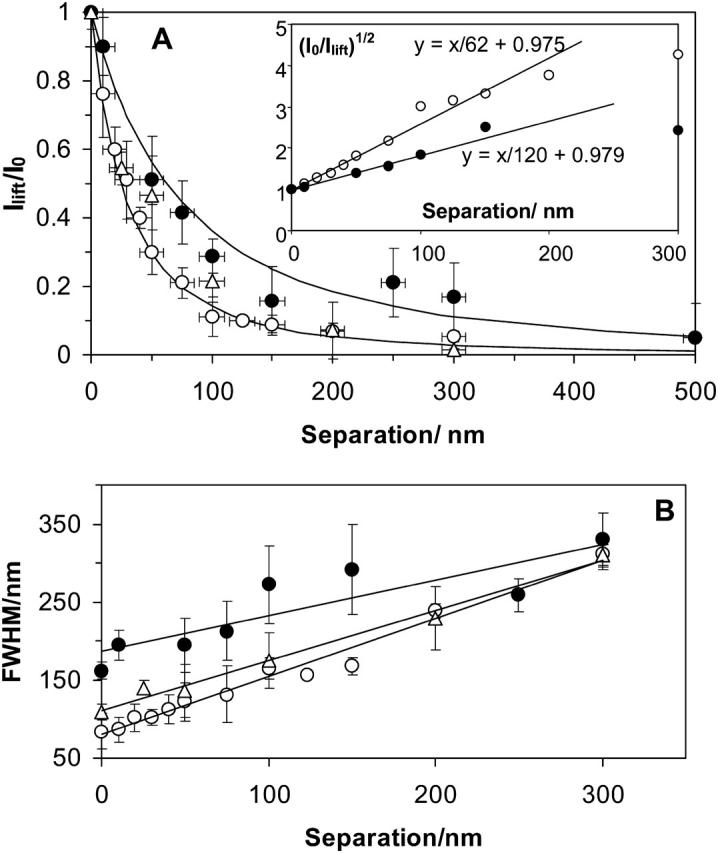
Near-field scanning optical microscopy (NSOM) has been used to study the nanoscale distribution of voltage-gated L-type Ca2+ ion channels, which play an important role in cardiac function. NSOM fluorescence imaging of immunostained cardiac myocytes (H9C2 cells) demonstrates that the ion channel is localized in small clusters with an average diameter of 100 nm. The clusters are randomly distributed throughout the cell membrane, with some larger fluorescent patches that high-resolution images show to consist of many small closely-spaced clusters. We have imaged unstained cells to assess the contribution of topography-induced artifacts and find that the topography-induced signal is <10% of the NSOM fluorescence intensity. We have also examined the dependence of the NSOM signal intensity on the tip-sample separation to assess the contributions from fluorophores that are significantly below the cell surface. This indicates that chromophores > approximately 200 nm below the probe will have negligible contributions to the observed signal. The ability to quantitatively measure small clusters of ion channels will facilitate future studies that examine changes in protein localization in stimulated cells and during cardiac development. Our work illustrates the potential of NSOM for studying membrane domains and protein localization/colocalization on a length scale which exceeds that available with optical microscopy.


Figures

FIGURE 1
FIGURE 1
Fluorescence microscopy image of H9C2 cells stained for the L-type Ca2+ channel.
FIGURE 2
FIGURE 2
Topography (A and D), NSOM (B and E), and composite 3-D (C and F) images of H9C2 cells stained for the L-type Ca2+ channel, excitation wavelength 568.5 nm, probe aperture size ∼60 nm. The 5 × 5 μm2 images (D and E) were obtained by zooming the indicated area of the cell. The 3-D images display a combination of the topographic data (height) and fluorescence data (color-coded).
FIGURE 3
FIGURE 3
Cross section through one of the smallest features observed in the NSOM fluorescence images of H9C2 cells stained for the L-type Ca2+ channel.
FIGURE 4
FIGURE 4
Histograms of cluster size for three NSOM images of H9C2 cells stained for the L-type Ca2+ channel.
FIGURE 5
FIGURE 5
Topography and optical images of H9C2 cells stained with secondary antibody only, excitation wavelength 568.5 nm, probe aperture size ∼60 nm. The contrast in the optical image correlates with topography changes, as shown by the coincidence of the features in the cross sections shown below each image.
FIGURE 6
FIGURE 6
Schematic representation of the interleave mode experiment: the sample (PVA film containing 40-nm diameter fluorescent spheres) is kept in the focal plane of the microscope objective, while the aperture (diameter d) is moved off the surface to a desired distance (h).
FIGURE 7
FIGURE 7
NSOM fluorescence images of 40-nm fluorescent spheres embedded in a 40-nm layer of PVA for zero separation (left column) and different interleave heights (right column): 30, 50, 100, 200, and 300 nm. The excitation wavelength is 568.5 nm, objective 100× oil immersion, 1.3 NA, and probe aperture size ∼60 nm.
FIGURE 8
FIGURE 8
(A) Dependence of the LiftMode relative intensity of the maximum fluorescence signal across a sphere (Ilift/I0, averaged over many spheres) on the tip-to-sample separation for 60- (○) and 150-nm (•) probes. The solid lines show the decay predicted by a (d/(d + h))2 function, where d is the NSOM probe aperture diameter and h is the tip-to-sample separation. Inset: the dependence of (I0/Ilift)1/2 on separation for ∼60 nm and ∼150 nm probe apertures. (B) Dependence of the measured sphere size (FWHM) on the separation between the tip and the sample for aperture diameters of 60 nm (○ and ▵) and 150 nm (•). 100× NA = 1.3 (○) and 40× NA = 0.65 (• and ▵) objectives were used.

References

    1. Block, B. A., T. Imagawa, K. P. Campbell, and C. Franzini-Armstrong. 1988. Structural evidence for direct interaction between the molecular components of the transverse tubule/sarcoplasmic reticulum junction in skeletal muscle. J. Cell Biol. 107:2587–2600. - PMC - PubMed
    1. Burgos, P., Z. Lu, A. Ianoul, C. Hnatovsky, M. L. Viriot, L. J. Johnston, and R. S. Taylor. 2003a. Near-field scanning optical microscopy probes: a comparison of pulled and double-etched bent NSOM probes for fluorescence imaging of biological samples. J. Microsc. 211:37–47. - PubMed
    1. Burgos, P., C. Yuan, M.-L. Viriot, and L. J. Johnston. 2003b. Two-color near-field fluorescence microscopy studies of microdomains (‘Rafts’) in model membranes. Langmuir. 19:8002–8009.
    1. Catterall, W. A. 1995. Structure and function of voltage-gated channels. Annu. Rev. Biochem. 64:493–531. - PubMed
    1. Catterall, W. A. 2000. Structure and regulation of voltage-gated Ca2+ channels. Annu. Rev. Cell Dev. Biol. 16:521–555. - PubMed

Publication types

MeSH terms

Substances