. 2004 Sep;24(18):7829-40.
doi: 10.1128/MCB.24.18.7829-7840.2004.

RhoE inhibits cell cycle progression and Ras-induced transformation

Affiliations

RhoE inhibits cell cycle progression and Ras-induced transformation

Priam Villalonga et al. Mol Cell Biol. 2004 Sep.

Abstract

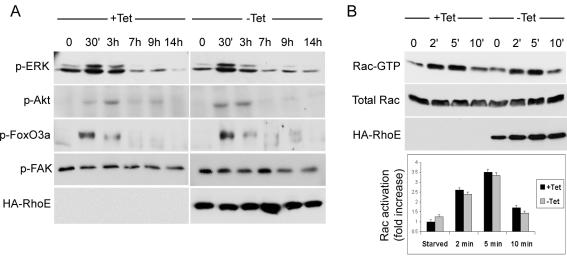
Rho GTPases are major regulators of cytoskeletal dynamics, but they also affect cell proliferation, transformation, and oncogenesis. RhoE, a member of the Rnd subfamily that does not detectably hydrolyze GTP, inhibits RhoA/ROCK signaling to promote actin stress fiber and focal adhesion disassembly. We have generated fibroblasts with inducible RhoE expression to investigate the role of RhoE in cell proliferation. RhoE expression induced a loss of stress fibers and cell rounding, but these effects were only transient. RhoE induction inhibited cell proliferation and serum-induced S-phase entry. Neither ROCK nor RhoA inhibition accounted for this response. Consistent with its inhibitory effect on cell cycle progression, RhoE expression was induced by cisplatin, a DNA damage-inducing agent. RhoE-expressing cells failed to accumulate cyclin D1 or p21(cip1) protein or to activate E2F-regulated genes in response to serum, although ERK, PI3-K/Akt, FAK, Rac, and cyclin D1 transcription was activated normally. The expression of proteins that bypass the retinoblastoma (pRb) family cell cycle checkpoint, including human papillomavirus E7, adenovirus E1A, and cyclin E, rescued cell cycle progression in RhoE-expressing cells. RhoE also inhibited Ras- and Raf-induced fibroblast transformation. These results indicate that RhoE inhibits cell cycle progression upstream of the pRb checkpoint.


Figures

FIG. 1.
FIG. 1.
Inducible expression of RhoE in RhoE-3T3 cells promotes loss of stress fibers and focal adhesions. RhoE-3T3 cells were grown in the presence (+Tet) or absence (−Tet) of tetracycline. (A) HA-RhoE expression following Tet removal was analyzed by Western blotting with an anti-HA antibody. (B) Fixed RhoE-3T3 cells were stained for F-actin and HA-RhoE with TRITC-labeled phalloidin and an anti-HA antibody, respectively. Bar, 5 μm. (C) Same as panel B, but the cells were stained for F-actin and vinculin with TRITC-labeled phalloidin and an antivinculin antibody, respectively. (D) RhoE-3T3 cells were fixed at the indicated time points after tetracycline removal and stained for F-actin and HA-RhoE with TRITC-labeled phalloidin and an anti-HA antibody, respectively. Bar, 5 μm. Similar results were obtained for three independent clones of RhoE-3T3 cells.
FIG. 2.
FIG. 2.
RhoE blocks G1-phase cell cycle progression. (A) RhoE-3T3 cells (left) or N37RhoE-3T3 cells (right) were plated and grown in the presence (+Tet) or absence (−Tet) of tetracycline, and cell growth was analyzed by counting the number of cells every 24 h. (B) RhoE-3T3 cells were grown in the presence or absence of tetracycline for 24 h and then harvested, and their DNA contents were analyzed by flow cytometry as described in Materials and Methods. (C) RhoE-3T3 cells were starved for 24 h in 0.5% FCS-containing medium in the presence or absence of tetracycline and then were stimulated with 10% FCS for the indicated times, harvested, and analyzed as for panel B. (D) RhoE-3T3 cells grown on coverslips were starved for 24 h in 0.5% FCS-containing medium in the presence or absence of tetracycline (starved) and were then stimulated with 10% FCS for 20 h in the presence or absence of tetracycline. Both starved and stimulated cells were incubated for the last 2 h with BrdU, fixed, and stained as described in Materials and Methods. The graph represents the mean values of BrdU-positive cells (calculated as percentages for >200 cells) from three independent experiments. The standard error for each value is shown. The data for panels A, B, and C are representative results from three independent experiments. The results shown in panel A were confirmed with two independently isolated clones of RhoE-3T3 cells and with a polyclonal (>50 clones) RhoE-3T3 cell population.
FIG. 3.
FIG. 3.
Neither ROCK nor RhoA inhibition mediates RhoE-induced cell cycle arrest. (A) RhoE-3T3 cells grown on coverslips were starved for 24 h in 0.5% FCS-containing medium in the presence or absence of tetracycline (starved) and were then stimulated with 10% FCS for 20 h in the presence (+Tet) or absence (−Tet) of tetracycline or with 10 μM Y-27632 in the presence of tetracycline (+Y-27632). The cells were incubated for the last 2 h with BrdU, fixed, and stained as indicated in Materials and Methods. The graph represents the mean values of BrdU-positive cells (calculated as percentages for >200 cells) from three independent experiments. The standard error for each value is shown. (B) RhoE-3T3 cells were grown in the presence or absence of tetracycline and harvested at the indicated time points after tetracycline removal. RhoA activation was analyzed by GST-rhotekin pull-down followed by Western blotting with an anti-RhoA antibody (top). An aliquot of each lysate was also loaded in another gel to analyze total RhoA (middle) and HA-RhoE (bottom) protein levels. (C) Same as panel B, but the cells were starved for 24 h in 0.5% FCS-containing medium in the presence or absence of tetracycline and were then stimulated with 10% FCS and harvested at the indicated time points. The graph represents the quantified mean RhoA activation (Rho-GTP/total Rho) ± SD from three independent experiments. (D) RhoE-3T3 cells stably transfected with Flag-RhoAV14 were plated and grown in the presence (+Tet) or absence (−Tet) of tetracycline, and cell growth was analyzed by counting the number of cells every 24 h.
FIG. 4.
FIG. 4.
RhoE prevents cyclin D1 and p21cip1 protein expression and E2F-dependent transcription. (A) RhoE-3T3 cells were starved for 24 h in 0.5% FCS-containing medium in the presence (+Tet) or absence (−Tet) of tetracycline and were then stimulated with 10% FCS in the presence or absence of tetracycline and harvested at the indicated time points. The expression levels of cyclin D1, p21cip1, p27kip1, cdk4, cdk2, and HA-RhoE were analyzed by Western blotting with the indicated specific antibodies. (B) Same as panel A, but the expression levels of p107 and cyclin A were analyzed. (C) RhoE-3T3 cells were transiently transfected with the E2F luciferase reporter plasmid, grown for 48 h in the presence or absence of tetracycline (growing) or starved for 24 h in 0.5% FCS-containing medium (starved) in the presence or absence of tetracycline, and then stimulated with 10% FCS in the presence or absence of tetracycline for the indicated times. The cells were harvested, and luciferase activities were measured and represented as indicated in Materials and Methods.
FIG. 5.
FIG. 5.
RhoE does not alter signaling pathways upstream of cyclin D1 induction. (A) RhoE-3T3 cells were starved for 24 h in 0.5% FCS-containing medium in the presence (+Tet) or absence (−Tet) of tetracycline and were then stimulated with 10% FCS in the presence or absence of tetracycline and harvested at the indicated time points. The levels of phospho-ERK, phospho-Akt, phospho-FoxO3a, phospho-FAK, and HA-RhoE were analyzed by Western blotting with the indicated specific antibodies. (B) RhoE-3T3 cells were starved for 24 h in 0.5% FCS-containing medium in the presence (+Tet) or absence (−Tet) of tetracycline and were then stimulated with 10% FCS and harvested at the indicated time points. Rac activation was analyzed by a GST-PBD pull-down assay followed by Western blotting with an anti-Rac1 antibody (top). An aliquot of each lysate was also loaded in another gel to analyze total Rac (middle) and HA-RhoE (bottom) protein levels. The graph represents the quantified mean Rac activation (Rac-GTP/total Rac) and SD from three independent experiments.
FIG. 6.
FIG. 6.
RhoE blocks cyclin D1 expression at the posttranscriptional level. (A) RhoE-3T3 cells were starved for 24 h in 0.5% FCS-containing medium in the presence (+Tet) or absence (−Tet) of tetracycline and were then stimulated with 10% FCS in the presence or absence of tetracycline and harvested at the indicated time points. Cyclin D1 mRNA levels were analyzed by Northern blotting as indicated in Materials and Methods. Values were normalized for loading variations and expressed as fold induction over the amount of cyclin D1 mRNA present in starved cells. (B) NIH 3T3 cells were transiently transfected with the cyclin D1 promoter reporter construct together with the indicated expression vectors. Forty-eight hours after transfection, the cells were harvested and luciferase activities were measured and represented as indicated in Materials and Methods. (C) RhoE-3T3 cells grown in the presence (+Tet) or absence (−Tet) of tetracycline were incubated with 100 μM aLLnL (Sigma) and harvested at the indicated time points. The expression levels of cyclin D1 were analyzed by Western blotting with specific antibodies, quantified by image analysis, and represented in the adjacent graph. (D) RhoE-3T3 cells grown in the presence (+Tet) or absence (−Tet) of tetracycline were incubated for 4 h with 100 μM aLLnL, after which the medium was removed, the cells were washed, and medium containing 10 μg of cycloheximide (CHX)/ml was added. The cells were harvested at the indicated time points. The expression levels of cyclin D1 were analyzed by Western blotting with specific antibodies, quantified by image analysis, and represented in the adjacent graph. (E) RhoE-3T3 cells were starved for 24 h in 0.5% FCS-containing medium in the presence (+Tet) or absence (−Tet) of tetracycline and were then stimulated for 7 h with 10% FCS in the presence or absence of tetracycline. The cells were then pulse labeled with [35S]methionine-cysteine for 30 min and harvested after the indicated chase times. Cyclin D1 was immunoprecipitated from the lysates as indicated in Materials and Methods. The graph represents the levels of radioactively labeled cyclin D1 measured by a phosphorimager and expressed in arbitrary units. All of the experiments shown in the figure were repeated three times with similar results.
FIG. 7.
FIG. 7.
RhoE-mediated cell cycle arrest is rescued by E7, E1A, and cyclin E. (A) RhoE-3T3 cells stably expressing the indicated vectors were plated and grown in the presence (+Tet) or absence (−Tet) of tetracycline, and cell growth was analyzed by counting the number of cells every 24 h. (B) RhoE-3T3 cells transiently transfected with the indicated vectors were starved for 24 h in 0.5% FCS-containing medium in the presence or absence of tetracycline, stimulated with 10% FCS for the indicated times, and then harvested. The DNA contents of the transfected cells were analyzed by flow cytometry as indicated in Materials and Methods. (C) RhoE-3T3 cells stably expressing the indicated vectors were starved for 24 h in 0.5% FCS-containing medium in the presence or absence of tetracycline, stimulated with 10% FCS for the indicated times, and then harvested. The DNA contents were analyzed by flow cytometry as indicated in Materials and Methods.
FIG. 8.
FIG. 8.
RhoE expression is increased in response to cisplatin. (A) NIH 3T3 cells were starved for 24 h in 0.5% FCS-containing medium, stimulated with 10% FCS for the indicated times, and then harvested. The levels of RhoE and α-tubulin were then analyzed by Western blotting. (B) NIH 3T3 cells were treated for 24 h with 0.1% (vol/vol) dimethyl sulfoxide as a vehicle or with 10 μM cisplatin, 0.22 μM daunorubicin, or 4 μM camptothecin, and the levels of RhoE, cyclin D1, and α-tubulin were analyzed by Western blotting.
FIG. 9.
FIG. 9.
RhoE blocks Ras- and Raf-induced transformation. (A) NIH 3T3 cells were transfected with the indicated expression plasmids and maintained in 5% serum for 12 to 15 days, with the medium replaced every 2 days. After 12 to 15 days, the cells were stained with crystal violet and the numbers of foci were counted. Shown are representative plates from a single experiment, conducted in duplicate. (B) Mean values from three independent experiments as described in panel A, each conducted in duplicate, are shown in the graph, representing the percentages of transformed foci relative to RasV12 transfectants. The standard error for each value is shown. (C) RhoE-3T3 cells were transfected with empty vector (control) or a RasV12 expression plasmid and maintained in 5% serum for 12 to 15 days, with the medium replaced every 2 days. During the last week, half of the plates were grown in the absence of tetracycline (−Tet). After 12 to 15 days, the cells were stained with crystal violet and the numbers of foci were counted. The mean values from three independent experiments, each conducted in duplicate, are shown in the graph, representing the percentages of transformed foci relative to RasV12 transfectants grown in the presence of tetracycline. The standard error for each value is shown.

Similar articles

Cited by

References

    1. Akashi, H., H. J. Han, M. Iizaka, and Y. Nakamura. 2000. Growth-suppressive effect of non-steroidal anti-inflammatory drugs on 11 colon-cancer cell lines and fluorescence differential display of genes whose expression is influenced by sulindac. Int. J. Cancer 88:873-880. - PubMed
    1. Assoian, R. K., and M. A. Schwartz. 2001. Coordinate signaling by integrins and receptor tyrosine kinases in the regulation of G1 phase cell-cycle progression. Curr. Opin. Genet. Dev. 11:48-53. - PubMed
    1. Bektic, J., O. A. Wrulich, G. Dobler, K. Kofler, F. Ueberall, Z. Culig, G. Bartsch, and H. Klocker. 2004. Identification of genes involved in estrogenic action in the human prostate using microarray analysis. Genomics 83:34-44. - PubMed
    1. Boyer, L., S. Travaglione, L. Falzano, N. C. Gauthier, M. R. Popoff, E. Lemichez, C. Fiorentini, and A. Fabbri. 2003. Rac GTPase instructs NF-κB activation by conveying the SCF complex and IκBα to the ruffling membranes. Mol. Biol. Cell 15:1124-1133. - PMC - PubMed
    1. Bradford, M. M. 1976. A rapid and sensitive method for the quantitation of microgram quantities of protein utilizing the principle of protein-dye binding. Anal. Biochem. 72:248-254. - PubMed

Publication types

MeSH terms