

Realistic spatial sampling for MEG beamformer images
- PMID: 15340934
- PMCID: PMC6872013
- DOI: 10.1002/hbm.20047
Realistic spatial sampling for MEG beamformer images
Abstract
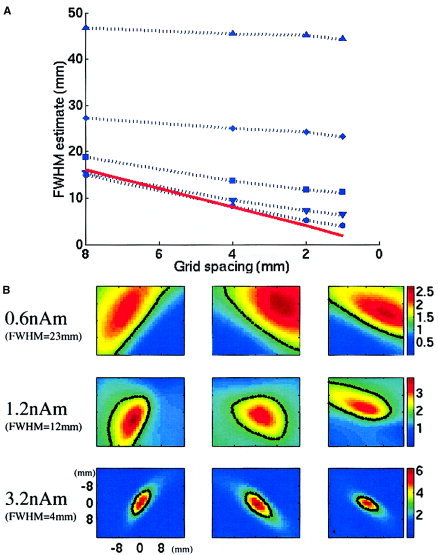
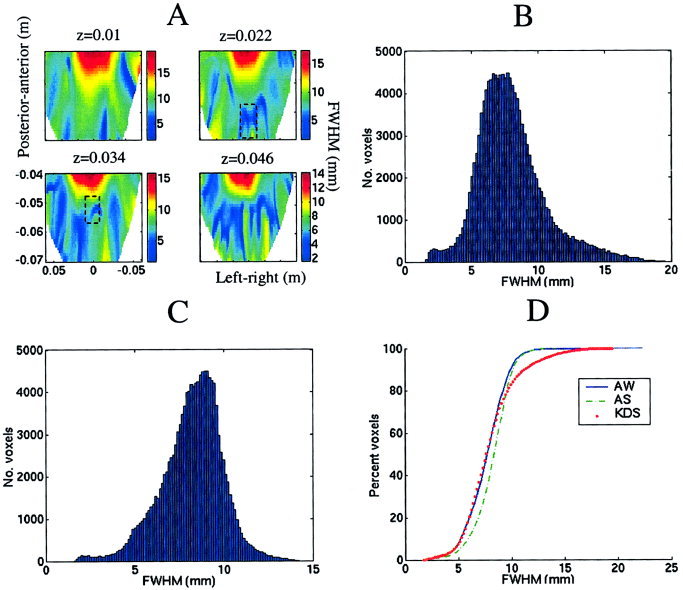
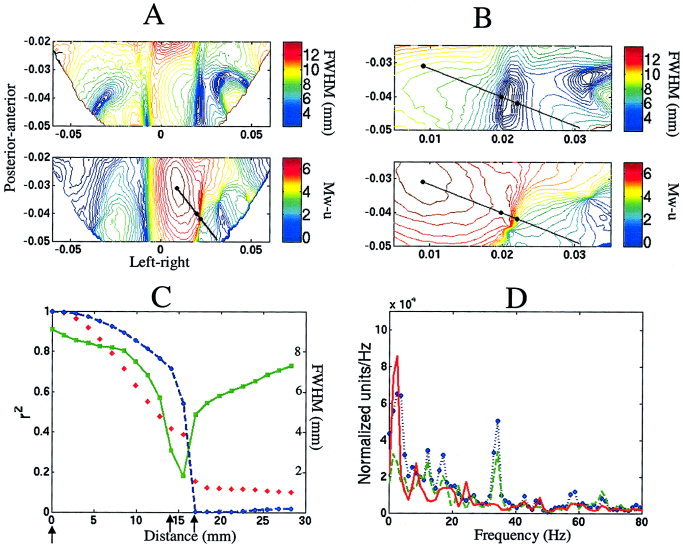
The spatial resolution achievable using magnetoencephalography (MEG) beamformer techniques is inhomogeneous across the brain and is related directly to the amplitude of the underlying electrical sources [Barnes and Hillebrand, Hum Brain Mapp 2003;18:1-12; Gross et al., Proc Natl Acad Sci USA 2001;98:694-699; Van Veen et al., IEEE Trans Biomed Eng 1997;44:867-860; Vrba and Robinson, Proc 12th Int Conf Biomagn 2001]. We set out to examine what an adequate level of spatial sampling of the brain volume is in a realistic situation, and what implications these inhomogeneities have for region-of-interest analysis. As a basis for these calculations, we used a simple retinotopic mapping experiment where stimuli were 17-Hz reversing gratings presented in either left or right visual hemifield. Beamformer weights were calculated based on the covariance of the MEG data in a 0-80 Hz bandwidth. We then estimated volumetric full-width half-maximum (FWHM) maps at a range of sampling levels. We show that approximately 10% of the 1 mm cubic voxels in the occipital volume have a FWHM smoothness of <5 mm, and 80% <10 mm in three subjects. This was despite relatively low mean signal-to-noise ratios (SNR) values of 1.5. We demonstrate how visualization of these FWHM maps can be used to avoid some of the pitfalls implicit in beamformer region-of-interest analysis.
The spatial resolution achievable using magnetoencephalography (MEG) beamformer techniques is inhomogeneous across the brain and is related directly to the amplitude of the underlying electrical sources [Barnes and Hillebrand, Hum Brain Mapp 2003;18:1–12; Gross et al., Proc Natl Acad Sci USA 2001;98:694–699; Van Veen et al., IEEE Trans Biomed Eng 1997;44:867–860; Vrba and Robinson, Proc 12th Int Conf Biomagn 2001]. We set out to examine what an adequate level of spatial sampling of the brain volume is in a realistic situation, and what implications these inhomogeneities have for region‐of‐interest analysis. As a basis for these calculations, we used a simple retinotopic mapping experiment where stimuli were 17‐Hz reversing gratings presented in either left or right visual hemifield. Beamformer weights were calculated based on the covariance of the MEG data in a 0–80 Hz bandwidth. We then estimated volumetric full‐width half‐maximum (FWHM) maps at a range of sampling levels. We show that approximately 10% of the 1 mm cubic voxels in the occipital volume have a FWHM smoothness of <5 mm, and 80% <10 mm in three subjects. This was despite relatively low mean signal‐to‐noise ratios (SNR) values of 1.5. We demonstrate how visualization of these FWHM maps can be used to avoid some of the pitfalls implicit in beamformer region‐of‐interest analysis. Hum. Brain Mapping 23:120–127, 2004. © 2004 Wiley‐Liss, Inc.
Figures
References
-
- Adjamian P, Barnes GR, Hillebrand A, Holliday IE, Singh KD, Furlong PL, Harrington E, Barclay C.W, Route PJG (2004): Co‐registration of MEG with MRI using bite‐bar‐based fiducials and surface‐matching. Clin Neurophysiol 115: 691–698. - PubMed
-
- Cuffin BN, Cohen D (1979): Comparison of the magnetoencephalogram and electroencephalogram. Electroencephalogr Clin Neurophysiol 47: 132–146. - PubMed
-
- Fawcett IP, Barnes GR, Hillebrand A, Singh KD (2004): The temporal frequency tuning of human visual cortex investigated using synthetic aperture magnetometry. Neuroimage 21: 1542–1543. - PubMed
-
- Friston KJ, Holmes A, Poline JB, Price CJ, Frith CD (1995): Detecting activations in PET and fMRI: levels of inference and power. Neuroimage 4: 223–235. - PubMed
Publication types
MeSH terms
Grants and funding
LinkOut - more resources
Full Text Sources
Research Materials
