. 2004 Sep;14(9):1797-805.
doi: 10.1101/gr.2546004.

Genome-scale in silico models of E. coli have multiple equivalent phenotypic states: assessment of correlated reaction subsets that comprise network states

Affiliations

Genome-scale in silico models of E. coli have multiple equivalent phenotypic states: assessment of correlated reaction subsets that comprise network states

Jennifer L Reed et al. Genome Res. 2004 Sep.

Abstract

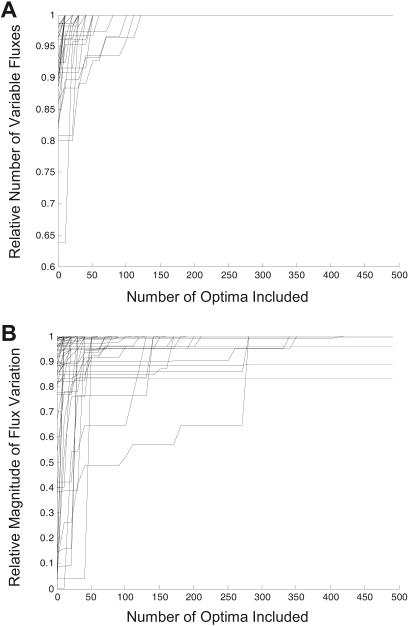
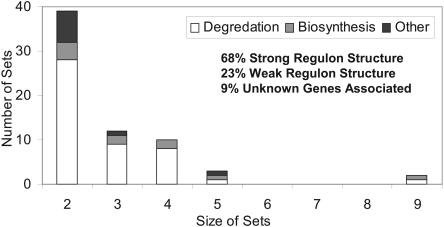
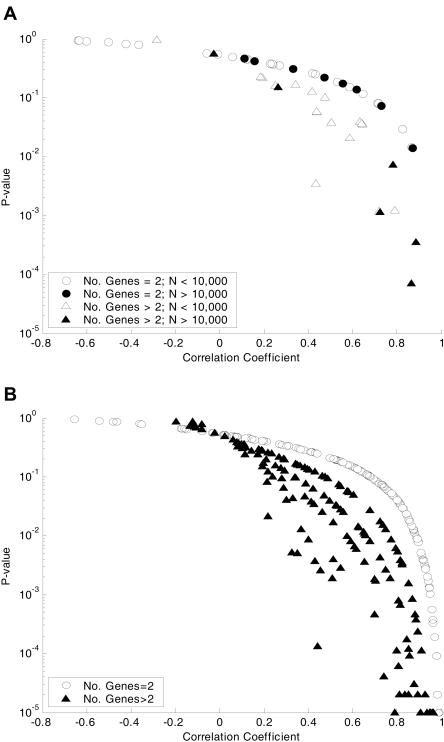
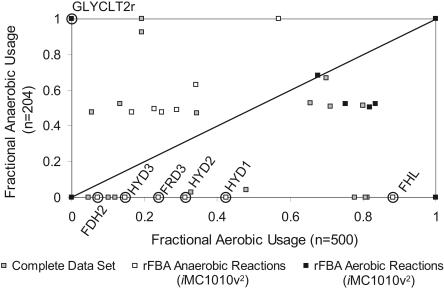
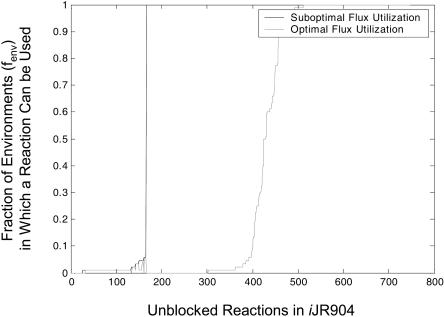
The constraint-based analysis of genome-scale metabolic and regulatory networks has been successful in predicting phenotypes and useful for analyzing high-throughput data sets. Within this modeling framework, linear optimization has been used to study genome-scale metabolic models, resulting in the enumeration of single optimal solutions describing the best use of the network to support growth. Here mixed-integer linear programming was used to calculate and study a subset of the alternate optimal solutions for a genome-scale metabolic model of Escherichia coli (iJR904) under a wide variety of environmental conditions. Analysis of the calculated sets of optimal solutions found that: (1) only a small subset of reactions in the network have variable fluxes across optima; (2) sets of reactions that are always used together in optimal solutions, correlated reaction sets, showed moderate agreement with the currently known transcriptional regulatory structure in E. coli and available expression data, and (3) reactions that are used under certain environmental conditions can provide clues about network regulatory needs. In addition, calculation of suboptimal flux distributions, using flux variability analysis, identified reactions which are used under significantly more environmental conditions suboptimally than optimally. Together these results demonstrate the utilization of reactions in genome-scale models under a variety of different growth conditions.


Figures

Figure 1
Figure 1
Comparisons of properties for sampled optima with all optima. The number of variable fluxes and the allowable ranges for these fluxes across all optima were calculated using a flux variability analysis. Each line is for one of the 88 carbon sources capable of supporting aerobic growth. (A) shows that as the number of calculated optima increases, the number of variable fluxes found in these sampled optimal solutions approaches the total number of variable fluxes. (B) shows how the magnitude of the flux variations is represented by the sampled optima relative to the actual flux variability across all optima.
Figure 2
Figure 2
Reaction usage in optimal flux distributions. (A) shows for each reaction in the metabolic network, what fraction of the optimal flux distributions utilize this reaction (fopt). The reactions are then rank-ordered by frequency of use in optimal flux distributions. Each reaction in the model was previously classified into one of 30 subsystems. (B) shows for each subsystem how many reactions belong to that subsystem (No. Rxns) and what fraction of these reactions are: never used (fopt = 0), used in less than 25% of the solutions (0 < fopt < 0.25), used in between 25% and 50% of the solutions (0.25 < fopt < 0.5), used in between 50% and 75% of the solutions (0.5 < fopt < 0.75), used in between 75% and 100% of the solutions (0.75 < fopt < 1), and used in all of the solutions (fopt = 1). The individual fractions are shaded according to value: less than 0.1 is white, between 0.1 and 0.5 is light gray, and larger than 0.5 is dark gray.
Figure 3
Figure 3
Distribution of correlated reaction sets. The 66 correlated reaction sets can be categorized by the number of reactions in a set as well as the set's metabolic purpose (metabolite biosynthesis or degradation or other). Using known regulation from databases and available literature, 45 out of 66 sets involved genes where at least half of the genes belonged to the same regulon (strong regulation). For six of the two reaction sets, one or both of the reactions were not associated with any genes, so no comparison could be made.
Figure 4
Figure 4
Correlation of genes in correlated reaction sets and transcription units based on expression data. The average correlation coefficients between genes associated with reactions in correlated reaction sets was calculated using a set of publicly available (ASAP) expression data from 20 different conditions. The calculated average correlation coefficients and their corresponding P-values are plotted in A (six of the two reaction sets were omitted from the graph because at least one of the reactions had no associated genes). Circles are used to denote small sets (only two genes with expression data), and triangles are used to denote larger sets (greater than two genes with expression data); open shapes are used for sets that are used in less than 10,000 optimal solutions, and filled shapes are used for sets used in more than 10,000 optimal solutions. (B) shows average correlation coefficients between genes on the same transcription unit (Karp et al. 2002) using the same set of expression data. Open circles are used to denote small sets (only two genes with expression data) and solid triangles to denote larger sets (greater than two genes with expression data).
Figure 5
Figure 5
Preferential usage of fluxes under aerobic glucose vs. anaerobic glucose optimal growth. Each point in the graph represents one of the 931 metabolic reactions; the x-axis plots the fraction of optimal solutions that utilize that reaction under glucose aerobic conditions (500 optima), and the y-axis plots the fraction of optimal solutions that utilize that reaction under glucose anaerobic conditions (204 optima). Using a regulatory model (iMC1010v2) that accounts for known regulation and hypothesized regulation based on expression data, some reactions were predicted to have more isozymes present aerobically (black) or more isozymes present anaerobically (white). Discrepancies between regulation and usage of fluxes in alternate optima are circled and labeled in the figure, see text for further details.
Figure 6
Figure 6
Reaction usage in optimal and suboptimal flux distributions. For each of the tested 88 aerobic environmental conditions, reactions were classified as being used in optimal solutions or used only in suboptimal solutions. The black line in the figure shows for each reaction the fraction of environments (fenv) that can use this reaction suboptimally. The gray line in the figure shows for each reaction the fraction of environments that can use this reaction in optimal solutions. The 185 blocked reactions in the network are not shown in the figure.

References

    1. Allen, T.E., Herrgard, M.J., Liu, M., Qiu, Y., Glasner, J.D., Blattner, F.R., and Palsson, B.Ø. 2003. Genome-scale analysis of the uses of the Escherichia coli genome: Model-driven analysis of heterogeneous data sets. J. Bacteriol. 185: 6392-6399. - PMC - PubMed
    1. Almaas, E., Kovacs, B., Vicsek, T., Oltvai, Z.N., and Barabasi, A.L. 2004. Global organization of metabolic fluxes in the bacterium Escherichia coli. Nature 427: 839-843. - PubMed
    1. Beard, D.A., Liang, S.D., and Qian, H. 2002. Energy balance for analysis of complex metabolic networks. Biophys. J. 83: 79-86. - PMC - PubMed
    1. Burgard, A.P. and Maranas, C.D. 2001. Probing the performance limits of the Escherichia coli metabolic network subject to gene additions or deletions. Biotechnol. Bioeng. 74: 364-375. - PubMed
    1. Burgard, A.P., Vaidyaraman, S., and Maranas, C.D. 2001. Minimal reaction sets for Escherichia coli metabolism under different growth requirements and uptake environments. Biotechnol. Prog. 17: 791-797. - PubMed

WEB SITE REFERENCES

    1. https://asap.ahabs.wisc.edu/~glasner/Protocols/DataDefinitionDefinitions...; Web site describes how the estimated transcript copy number is calculated from the gene expression data.

Publication types

LinkOut - more resources