. 2004 Sep 1;24(35):7604-13.
doi: 10.1523/JNEUROSCI.5328-03.2004.

Suprachiasmatic GABAergic inputs to the paraventricular nucleus control plasma glucose concentrations in the rat via sympathetic innervation of the liver

Affiliations

Suprachiasmatic GABAergic inputs to the paraventricular nucleus control plasma glucose concentrations in the rat via sympathetic innervation of the liver

Andries Kalsbeek et al. J Neurosci. .

Abstract

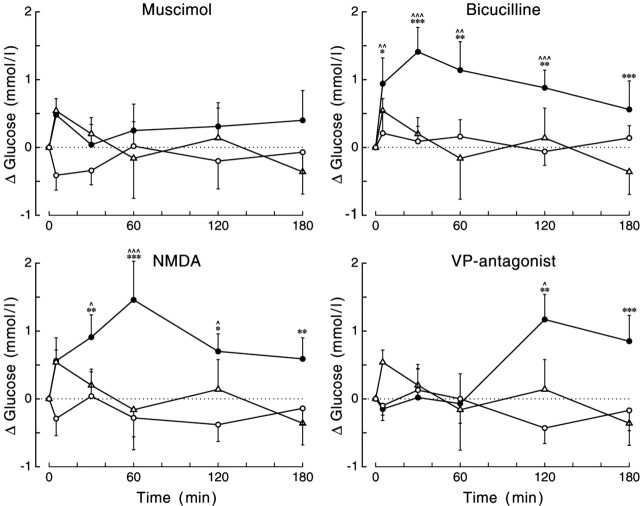
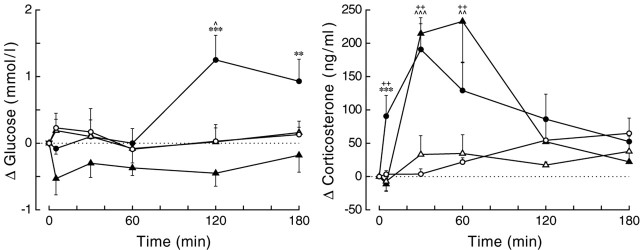
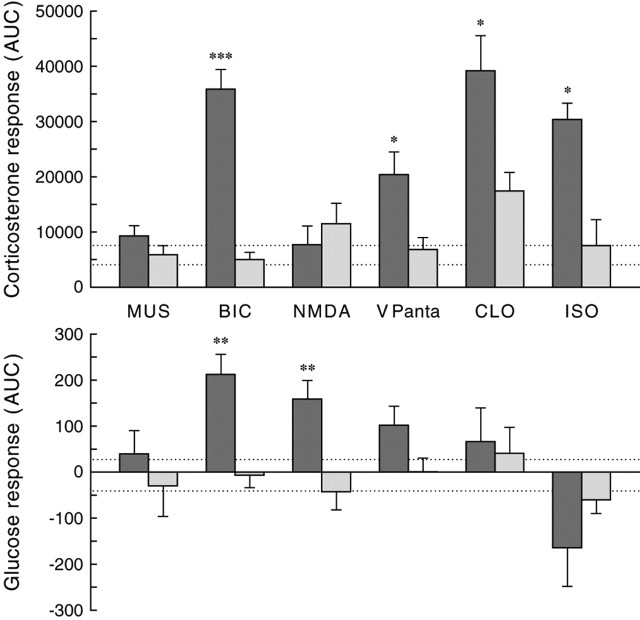
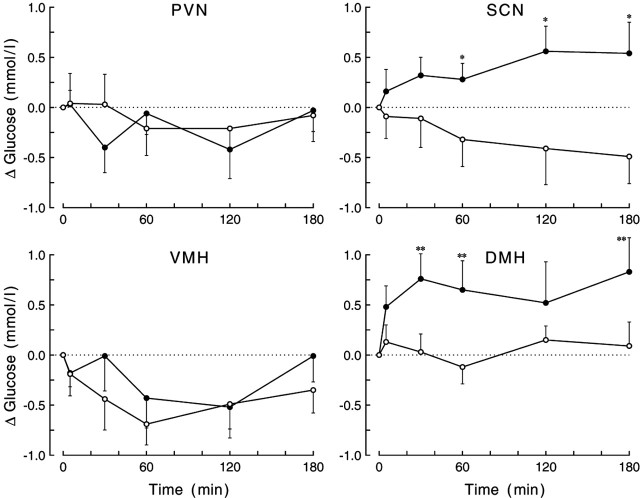
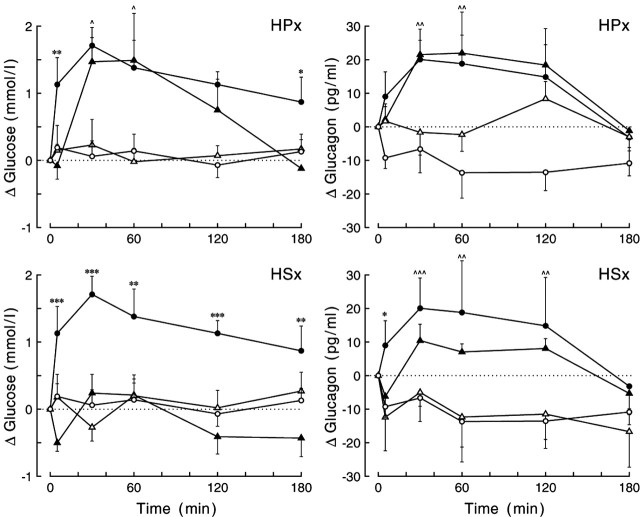
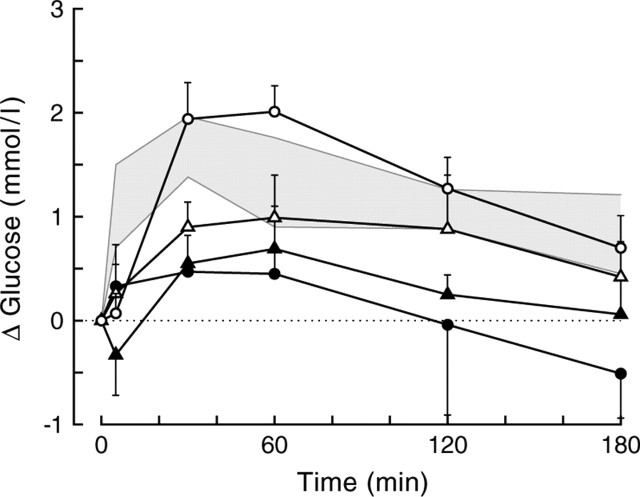
Daily peak plasma glucose concentrations are attained shortly before awakening. Previous experiments indicated an important role for the biological clock, located in the suprachiasmatic nuclei (SCN), in the genesis of this anticipatory rise in plasma glucose concentrations by controlling hepatic glucose production. Here, we show that stimulation of NMDA receptors, or blockade of GABA receptors in the paraventricular nucleus of the hypothalamus (PVN) of conscious rats, caused a pronounced increase in plasma glucose concentrations. The local administration of TTX in brain areas afferent to the PVN revealed that an important part of the inhibitory inputs to the PVN was derived from the SCN. Using a transneuronal viral-tracing technique, we showed that the SCN is connected to the liver via both branches of the autonomic nervous system (ANS). The combination of a blockade of GABA receptors in the PVN with selective removal of either the sympathetic or parasympathetic branch of the hepatic ANS innervation showed that hyperglycemia produced by PVN stimulation was primarily attributable to an activation of the sympathetic input to the liver. We propose that the daily rise in plasma glucose concentrations is caused by an SCN-mediated withdrawal of GABAergic inputs to sympathetic preautonomic neurons in the PVN, resulting in an increased hepatic glucose production. The remarkable resemblance of the presently proposed control mechanism to that described previously for the control of daily melatonin rhythm suggests that the GABAergic control of sympathetic preautonomic neurons in the PVN is an important pathway for the SCN to control peripheral physiology.


Figures

Figure 1.
Figure 1.
A-H, Transversal sections of the spinal cord (A, B), brainstem (C, D), and hypothalamus (E-H) stained for the transneuronal tracer (PRV). A, C, E, and G are sections from HSx rats, andB, D, F, and H are sections from HPx rats. A, B, Sections of the spinal cord at the thoracic level. The surviving time after PRV injection in the liver is 4 d. HSx rats do not show first-order labeling in the IML of the thoracic part of the spinal cord (A), where as first-order PRV labeling is observed in the thoracic part of the IML of the HPx rats (B). C, D, Sections at the level of the brainstem. The survival time after PRV injection in the liver is 5 d (C) or 6 d (D). PRV labeling is observed in the DMV of HSx rats (C) but not in the DMV of HPx rats (D). E-H, Sections at the level of the hypothalamus. The survival time is 6 d. Intense PRV labeling is observed in the PVN of both HSx rats (E) and HPx rats (F). PRV-labeled neurons are clearly observed in the SCN of HSx rats (G) and HPx rats (H).
Figure 2.
Figure 2.
A-D, Photomicrographs illustrating the bilateral placement of microdialysis probes in the PVN (A, B) and DMH (C, D). Probe placements in four different animals are shown to illustrate the limited variation in probe placement. Moreover, these sections also illustrate clearly that the tissue damage caused by the placement of microdialysis probes is only limited.
Figure 3.
Figure 3.
Changes in plasma glucose concentrations during a 2 hr administration of bicuculline, muscimol, NMDA, or VP antagonist in the PVN. Filled symbols indicate the effect of the drug, whereas open symbols show the result of the control experiment in the same group of animals (circles) or the effect of Ringer administration in a separate group of animals (triangles). All drugs except MUS caused a significant increase in plasma glucose concentrations. MANOVA indicated significant effects of day (i.e., experimental vs control) and treatment (i.e., drug vs Ringer) for both BIC and NMDA (p = 0.001 and p = 0.004, and p = 0.002 and p = 0.012, respectively). Moreover, all three drugs showed significant interaction effects of both sampling versus day and sampling versus treatment. For basal (t = 0) concentrations and additional statistical details, see supplemental Tables 1 and 2 (available at www.jneurosci.org as supplemental material), respectively. *,^p < 0.1, **,^^p < 0.05, and ***,^^^p < 0.01, respectively. Symbols indicate the results of paired (^) (i.e., experimental vs control) and unpaired (*) (i.e., drug vs Ringer) Student's t tests.
Figure 4.
Figure 4.
Changes in plasma glucose and plasma corticosterone concentrations as a result of VP antagonist administration in either the PVN (circles) or DMH (triangles). Despite the comparable responses of plasma corticosterone (p = 0.621 and p = 0.047 for group and group × sample effects, respectively), the effects of the VP antagonist on plasma glucose are clearly dissimilar (p = 0.011 and p = 0.005 for effects of group and group × sample, respectively). Closed symbols represent the effect of the VP antagonist, and open symbols represent results of the control experiment. ^p < 0.1, **,^^,++p < 0.05, ***,^^^p < 0.01. The asterisks indicate the results of the unpaired (i.e., PVN vs DMH) Student's t tests. ^ and + indicate the results of paired (i.e., experimental day vs control day) Student's t tests for the PVN (^) and DMH (+), respectively.
Figure 5.
Figure 5.
Differential plasma corticosterone and plasma glucose responses as a consequence of a 2 hr administration of MUS, BIC, NMDA, VP antagonist (VPanta), CLO, or ISO in the PVN. Corticosterone and glucose responses are expressed as area under the curve to reflect the overall change in the 3 hr sampling period. The AUC was calculated from the incremental data for each individual animal. The dark bars indicate the integrated response (AUC) during drug administration, and the light bars indicate the response during the control experiment 1 week later. Dashed lines indicate the higher and lower limits (i.e., mean ± SEM) of the corticosterone and glucose response during the administration of Ringer into the PVN. *p < 0.05, **p < 0.01, ***p < 0.001 according to paired Student's t tests.
Figure 6.
Figure 6.
Changes in plasma glucose concentrations during the 2 hr administration of TTX in the PVN, SCN, VMH, or DMH. Only inhibition of neuronal activity in the DMH and SCN induced a significant change (i.e., increase) in plasma glucose concentrations, respectively (p = 0.030 and p = 0.015 for the drug × sampling interaction). For basal concentrations (t = 0) and additional statistical details, see supplemental Tables 3 and 4 (available at www.jneurosci.org as supplemental material). Closed symbols indicate the effect of TTX administration, whereas open symbols show the result of the control experiment. *p < 0.1 and **p < 0.05 according to paired Student's t tests.
Figure 7.
Figure 7.
Changes in plasma glucose (left panels) and plasma glucagon (right panels) concentrations during the 2 hr administration of BIC in the PVN of liver-intact and liver-denervated animals. Data from the HPx and HSx liver-denervated animals are displayed in the top and bottom rows, respectively. In both intact and liver-denervated animals, all BIC-induced glucose and glucagon responses were significantly increased compared with the respective control experiments (p < 0.03 for all day × sampling interactions), except for the glucose response in HSx animals (bottom left). Moreover, only the glucose response in the HSx group differed significantly from that in liver-intact animals (p < 0.001 and p = 0.016 for group and group × sampling effects, respectively). In neither of the two liver-denervated groups did the glucagon response differ from that in liver-intact animals (p > 0.5 for both group and group × sampling effects). For basal t = 0 concentrations and additional statistics, see supplemental Tables 5 and 6 (available at www.jneurosci.org as supplemental material), respectively. Closed symbols indicate the effect of BIC, and open symbols show the results of the respective control experiments. Circles, Liver-intact animals; triangles, liver-denervated animals. *,^p < 0.1, **,^^p < 0.05, and ***,^^^p < 0.01, respectively. ^ and * indicate the results of paired (i.e., experimental day vs control day) Student's t tests in the liver-denervated animals and unpaired (i.e., liver-intact animals vs denervated animals on experimental days) Student's t tests, respectively.
Figure 8.
Figure 8.
Plasma glucose changes during BIC administration into or outside the PVN of liver-intact animals. Five different treatment groups are displayed. The gray shading indicates the mean ± SEM from the original group of PVN infusions (group A). Probe placements for the additional control group are divided in those within or touching the PVN (group B; open circles; n = 7), those within <1 mm of the caudal borders of the PVN (group C1; open triangles; n = 7), those within <1 mm of the lateral or rostral borders of the PVN (group C2; closed triangles; n = 5), and those > 1 mm away from the caudal border of the PVN (group D; closed circles; n = 5). Depending on whether groups C1 and C2 were separated or combined, the MANOVA for the overall data showed significant effects of group (p = 0.023 and p = 0.019, respectively) and group × time (p = 0.092 and p = 0.018, respectively). Comparing the different groups displaying probe placements outside the PVN (i.e., C1, C2, D) with the within-PVN placement group (i.e., B) revealed significant group effects for groups C2 and D (p = 0.003 and p = 0.008, respectively) and significant group × time effects for groups C1, C2, and D (p = 0.035, p = 0.024, and p = 0.052, respectively). When compared with the original within-PVN group (i.e., the gray area), significant effects of group were found for groups C and D (p = 0.033 and p = 0.007, respectively), and a significant group × time effect was found for group B (p = 0.045). Separating group C in caudal (C1) and lateral plus rostral (C2) placements revealed that only group C2 differed significantly from group A (p = 0.004 for the effect of group). In all groups except for groups C2 and D, the within-animal comparison showed significant effects of day and day × time (i.e., the BIC day differs significantly from the control day).

References

    1. Abe M, Saito M, Shimazu T (1989) Neuropeptide Y and norepinephrine injected into the paraventricular nucleus of the hypothalamus activate endocrine pancreas. Biomed Res 10: 431-436.
    1. Boden G, Chen X, Urbain JL (1996) Evidence for a circadian rhythm of insulin sensitivity in patients with NIDDM caused by cyclic changes in hepatic glucose production. Diabetes 45: 1044-1050. - PubMed
    1. Bolli GB, De Feo P, De Cosmo S, Perriello G, Ventura MM, Calcinaro F, Lolli C, Campbell P, Brunetti P, Gerich JE (1984) Demonstration of a dawn phenomenon in normal human volunteers. Diabetes 33: 1150-1153. - PubMed
    1. Boudaba C, Szabo K, Tasker JG (1996) Physiological mapping of local inhibitory inputs to the hypothalamic paraventricular nucleus. J Neurosci 16: 7151-7160. - PMC - PubMed
    1. Buijs RM, Markman M, Nunes-Cardoso B, Hou Y-X, Shinn S (1993) Projections of the suprachiasmatic nucleus to stress-related areas in the rat hypothalamus: a light and electron microscopic study. J Comp Neurol 335: 42-54. - PubMed

MeSH terms