. 2004 Sep 1;24(35):7640-7.
doi: 10.1523/JNEUROSCI.0737-04.2004.

The isoazimuthal perception of sounds across distance: a preliminary investigation into the location of the audio egocenter

Affiliations

The isoazimuthal perception of sounds across distance: a preliminary investigation into the location of the audio egocenter

Michael F Neelon et al. J Neurosci. .

Abstract

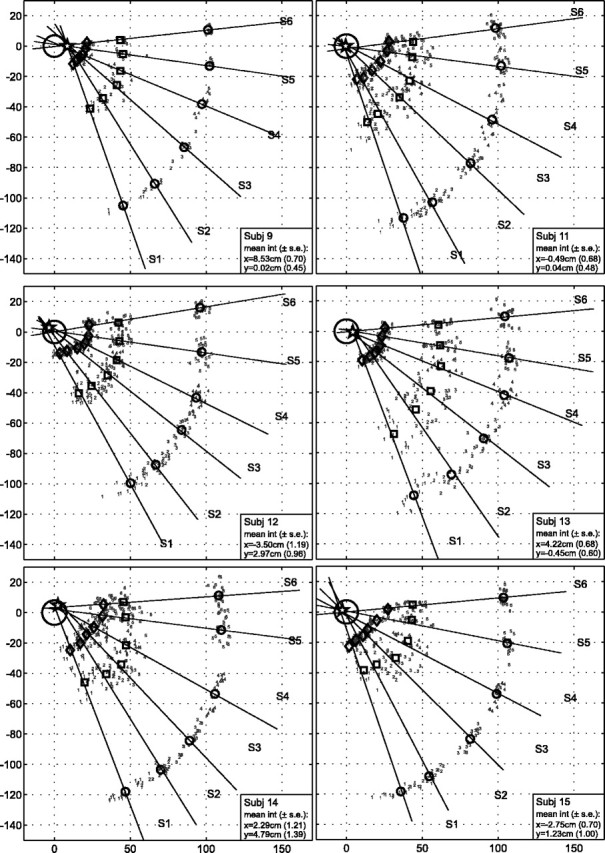
Evidence indicates that both visual and auditory input may be represented in multiple frames of reference at different processing stages in the nervous system. Most models, however, have assumed that unimodal auditory input is first encoded in a head-centered reference frame. The present work tested this conjecture by measuring the subjective auditory egocenter in six blindfolded listeners who were asked to match the perceived azimuths of sounds that were alternately played between a surrounding arc of far-field speakers and a hand-held point source located three different distances from the head. If unimodal auditory representation is head centered, then "isoazimuth" lines fitted to the matching estimates across distance should intersect near the midpoint of the interaural axis. For frontomedially arranged speakers, isoazimuth lines instead converged in front of the interaural axis for all listeners, often at a point between the two eyes. As far-field sources moved outside the visual field, however, the auditory egocenter location implied by the intersection of the isoazimuth lines retreated toward or even behind the interaural axis. Physiological and behavioral evidence is used to explain this change from an eye-centered to a head-centered auditory egocenter as a function of source laterality.


Figures

Figure 1.
Figure 1.
Methods used to estimate visual and auditory egocenters. A, From Funaishi (1926): observers matched the angle of a far visual target (A, B) at two distances (A1, A2 or B1, B2). Lines connecting far and near estimates for each target were extended back toward the head, and the visual egocenter was determined from their intersection (*). B, From Mitson et al.(1976) and Barbeito and Ono (1979): observers matched the angle of a far visual target using a track-mounted handle positioned at a single fixed distance in front of the head. Lines connecting the actual target locations (A, B) with the handle estimates (A1, B1) were extended back toward the head, and the egocenter was determined from their intersection. C, From Cox (1999): an auditory version of the method used by Mitson et al. (1976). For details, see Introduction. D, The present method is an auditory version of that used by Funaishi (1926) (A). For details, see Materials and Methods.
Figure 2.
Figure 2.
A bird's-eye view of the individual point-source estimates (small numerals) and fitted isoazimuth lines for the six listeners performing the azimuthal matching task to frontal speaker positions. The listener's head (large circle, averaged across blocks) is pointed toward positive values on the abscissa (all units are in centimeters). Symbols ⋄, □, and ○ indicate mean point-source estimates for near, intermediate, and far distance placements, respectively. Also shown are mean speaker positions (S) and intersection (star) of isoazimuth lines. Insets display mean and SE values of the intersection in Cartesian coordinates.
Figure 3.
Figure 3.
A bird's-eye view of the individual point-source estimates (points) and fitted isoazimuth lines for the six listeners performing the azimuthal matching task to lateral speaker positions. Orientation and symbols are the same as used in Figure 2.
Figure 4.
Figure 4.
A composite bird's-eye view of the individual point-source estimates (small numerals) and fitted isoazimuth lines for all azimuthal matching data to speakers encompassing the frontal visual field from both the original and replication experiments (speaker numbers 1-5 and 3-6, respectively). Head position (large circle) is averaged from measurements for each listener across the two experiments. Orientation and all other symbols are the same as used in Figures 2 and 3. For subject 14, the median isoazimuth intersection was used to estimate the auditory egocenter because isoazimuth lines for midline sources resulted in a highly skewed mean egocenter estimate.
Figure 5.
Figure 5.
The intersection points of each composite isoazimuth line with the median sagittal line (x, 0) as a function of absolute average speaker position for the data from the two experiments (symbols) combined across all listeners. “Front” or “Back” indicates in front of or behind the composite interaural axis (solid line). The diamond indicates the mean of the intersection points for all speakers less than ±10°.

References

    1. Altman JA, Variaguina OV, Nikitin NI (1999) Lateralization of a moving auditory image: interrelation of interaural time and intensity differences. J Acoust Soc Am 105: 366-376. - PubMed
    1. Barbeito R, Ono H (1979) Four methods of locating the egocenter: a comparison of their predictive validities and reliabilities. Behav Res Methods Instr 11: 31-36.
    1. Blauert J (1983) Spatial hearing—the psychacoustics of human sound localization, p 14. Cambridge, MA: MIT.
    1. Brungart D, Rabinowitz W (1999) Auditory localization of nearby sources. I. Head related transfer functions. J Acoust Soc Am 107: 2224-2235. - PubMed
    1. Brungart DS, Durlach NI, Rabinowitz WM (2000) Evaluation of response methods for the localization of nearby objects. Percept Psychophys 62: 48-65. - PubMed

Publication types