

Maturational differences in lung NF-kappaB activation and their role in tolerance to hyperoxia
- PMID: 15343385
- PMCID: PMC514581
- DOI: 10.1172/JCI19300
Maturational differences in lung NF-kappaB activation and their role in tolerance to hyperoxia
Abstract
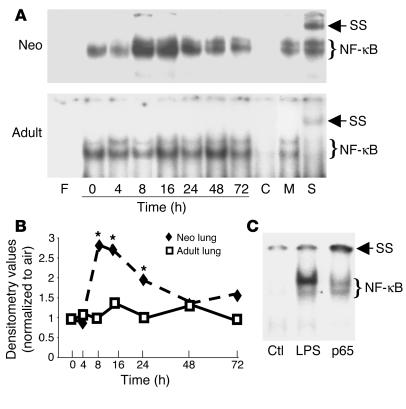
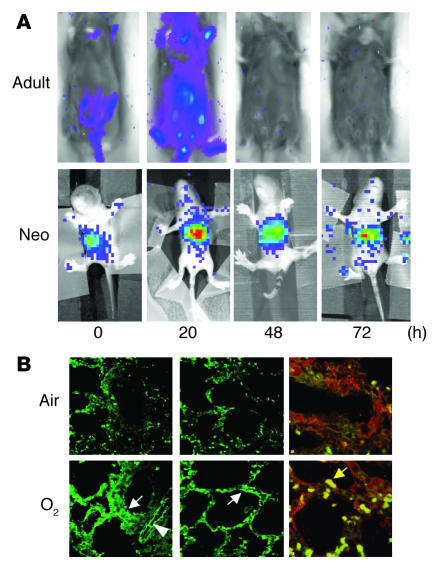
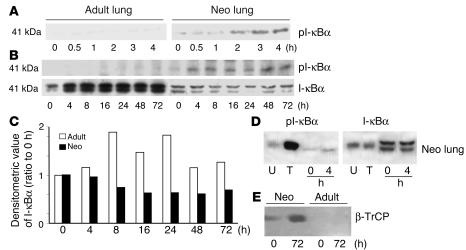
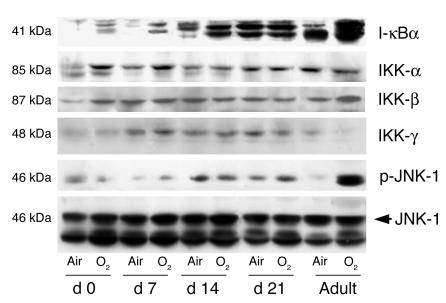
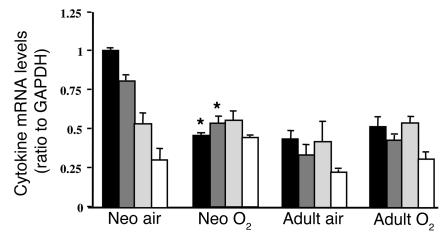
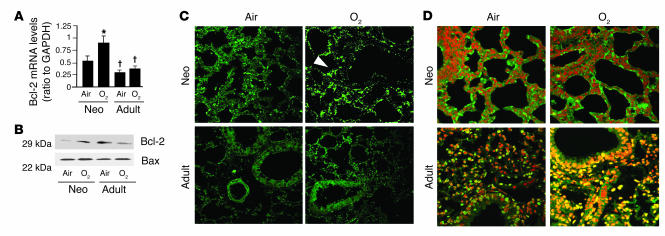
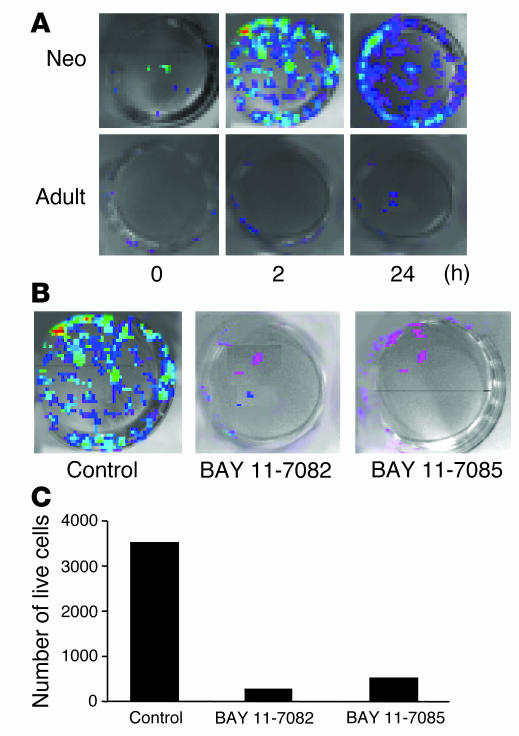
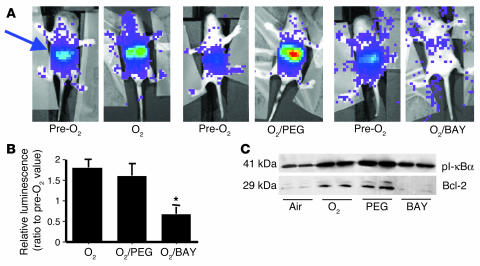
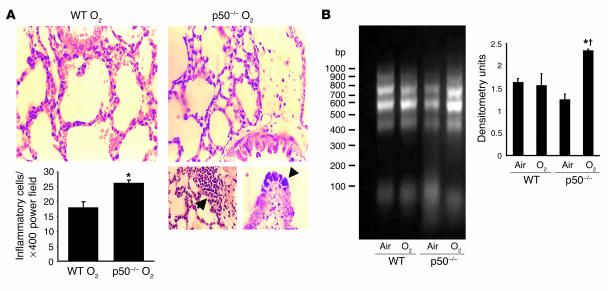
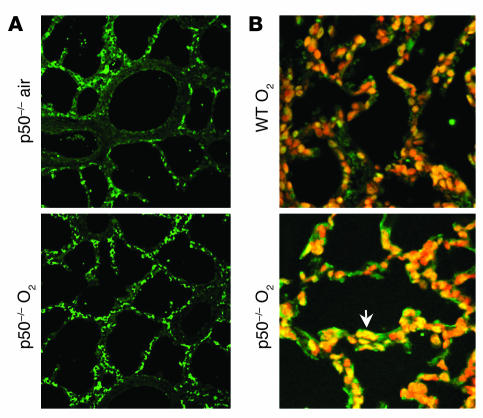
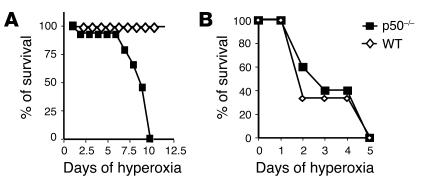
Neonatal rodents are more tolerant to hyperoxia than adults. We determined whether maturational differences in lung NF-kappaB activation could account for the differences. After hyperoxic exposure (O2 > 95%), neonatal (<12 hours old) lung NF-kappaB binding was increased and reached a maximum between 8 and 16 hours, whereas in adults no changes were observed. Additionally, neonatal NF-kappaB/luciferase transgenic mice (incorporating 2 NF-kappaB consensus sequences driving luciferase gene expression) demonstrated enhanced in vivo NF-kappaB activation after hyperoxia in real time. In the lungs of neonates, there was a propensity toward NF-kappaB activation as evidenced by increased lung I-kappaB kinase protein levels, I-kappaBalpha phosphorylation, beta-transducin repeat-containing protein levels, and total I-kappaBalpha degradation. Increased lung p-JNK immunoreactive protein was observed only in the adult lung. Inhibition of pI-kappaBalpha by BAY 11-7085 resulted in decreased Bcl-2 protein levels in neonatal lung homogenates and decreased cell viability in lung primary cultures after hyperoxic exposure. Furthermore, neonatal p50-null mutant (p50(-/-)) mice showed increased lung DNA degradation and decreased survival in hyperoxia compared with WT mice. These data demonstrate that there are maturational differences in lung NF-kappaB activation and that enhanced NF-kappaB may serve to protect the neonatal lung from acute hyperoxic injury via inhibition of apoptosis.
Figures
Similar articles
-
Sustained hyperoxia-induced NF-κB activation improves survival and preserves lung development in neonatal mice.Am J Physiol Lung Cell Mol Physiol. 2014 Jun 15;306(12):L1078-89. doi: 10.1152/ajplung.00001.2014. Epub 2014 Apr 18. Am J Physiol Lung Cell Mol Physiol. 2014. PMID: 24748603 Free PMC article.
-
Recombinant osteopontin attenuates hyperoxia-induced acute lung injury through inhibiting nuclear factor kappa B and matrix metalloproteinases 2 and 9.Chin Med J (Engl). 2014;127(23):4025-30. Chin Med J (Engl). 2014. PMID: 25430443
-
NF-kappaB protects lung epithelium against hyperoxia-induced nonapoptotic cell death-oncosis.Free Radic Biol Med. 2004 Nov 15;37(10):1670-9. doi: 10.1016/j.freeradbiomed.2004.08.007. Free Radic Biol Med. 2004. PMID: 15477018
-
Manipulation of gene expression by oxygen: a primer from bedside to bench.Pediatr Res. 2009 Jul;66(1):3-10. doi: 10.1203/PDR.0b013e3181a2c184. Pediatr Res. 2009. PMID: 19287338 Free PMC article. Review.
-
Pathways to cell death in hyperoxia.Chest. 1999 Jul;116(1 Suppl):64S-67S. doi: 10.1378/chest.116.suppl_1.64s. Chest. 1999. PMID: 10424596 Review. No abstract available.
Cited by
-
Inhibiting NF-κB in the developing lung disrupts angiogenesis and alveolarization.Am J Physiol Lung Cell Mol Physiol. 2012 May 15;302(10):L1023-36. doi: 10.1152/ajplung.00230.2011. Epub 2012 Feb 24. Am J Physiol Lung Cell Mol Physiol. 2012. PMID: 22367785 Free PMC article.
-
Developmental expression of the receptor for advanced glycation end-products (RAGE) and its response to hyperoxia in the neonatal rat lung.BMC Dev Biol. 2007 Mar 7;7:15. doi: 10.1186/1471-213X-7-15. BMC Dev Biol. 2007. PMID: 17343756 Free PMC article.
-
Oxidative stress and inflammation modulate Rev-erbα signaling in the neonatal lung and affect circadian rhythmicity.Antioxid Redox Signal. 2014 Jul 1;21(1):17-32. doi: 10.1089/ars.2013.5539. Epub 2014 Mar 14. Antioxid Redox Signal. 2014. PMID: 24252172 Free PMC article.
-
Silencing hyperoxia-induced C/EBPα in neonatal mice improves lung architecture via enhanced proliferation of alveolar epithelial cells.Am J Physiol Lung Cell Mol Physiol. 2011 Aug;301(2):L187-96. doi: 10.1152/ajplung.00082.2011. Epub 2011 May 13. Am J Physiol Lung Cell Mol Physiol. 2011. PMID: 21571903 Free PMC article.
-
NADPH oxidase-1 plays a crucial role in hyperoxia-induced acute lung injury in mice.Am J Respir Crit Care Med. 2009 Nov 15;180(10):972-81. doi: 10.1164/rccm.200902-0296OC. Epub 2009 Aug 6. Am J Respir Crit Care Med. 2009. PMID: 19661248 Free PMC article.
References
-
- Frank L, Bucher JR, Roberts RJ. Oxygen toxicity in neonatal and adult animals of various species. J. Appl. Physiol. 1978;45:699–704. - PubMed
-
- Hass MA, Massaro D. Differences in CuZn superoxide dismutase induction in lungs of neonatal and adult rats. Am. J. Physiol. 1987;253:C66–C70. - PubMed
-
- Hoffman M, Stevens JB, Autor AP. Adaptation to hyperoxia in the neonatal rat: kinetic parameters of the oxygen-mediated induction of lung superoxide dismutases, catalase and glutathione peroxidase. Toxicology. 1980;16:215–225. - PubMed
-
- Ischiropoulos H, Nadziejko CE, Kumae T, Kikkawa Y. Oxygen tolerance in neonatal rats: role of subcellular superoxide generation. Am. J. Physiol. 1989;257:L411–L420. - PubMed
-
- Crapo JD, McCord JM, Fridovich I. Preparation and assay of superoxide dismutases. Methods Enzymol. 1978;53:382–393. - PubMed
Publication types
MeSH terms
Substances
Grants and funding
LinkOut - more resources
Full Text Sources
Other Literature Sources
Molecular Biology Databases
Research Materials
Miscellaneous
