. 2004 Dec 15;384(Pt 3):469-76.
doi: 10.1042/BJ20031859.

Cyclo-oxygenase type 2-dependent prostaglandin E2 secretion is involved in retrovirus-induced T-cell dysfunction in mice

Affiliations

Cyclo-oxygenase type 2-dependent prostaglandin E2 secretion is involved in retrovirus-induced T-cell dysfunction in mice

Souad Rahmouni et al. Biochem J. .

Abstract

MAIDS (murine AIDS) is caused by infection with the murine leukaemia retrovirus RadLV-Rs and is characterized by a severe immunodeficiency and T-cell anergy combined with a lymphoproliferative disease affecting both B- and T-cells. Hyperactivation of the cAMP-protein kinase A pathway is involved in the T-cell dysfunction of MAIDS and HIV by inhibiting T-cell activation through the T-cell receptor. In the present study, we show that MAIDS involves a strong and selective up-regulation of cyclo-oxygenase type 2 in the CD11b+ subpopulation of T- and B-cells of the lymph nodes, leading to increased levels of PGE2 (prostaglandin E2). PGE2 activates the cAMP pathway through G-protein-coupled receptors. Treatment with cyclo-oxygenase type 2 inhibitors reduces the level of PGE2 and thereby reverses the T-cell anergy, restores the T-cell immune function and ameliorates the lymphoproliferative disease.


Figures
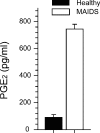
Figure 1
Figure 1. Secretion of PGE2 by lymph node cells from control and MAIDS mice in vitro
Mixed lymph node mononuclear cells from retrovirus-infected mice (0.5×10⁶ cells/well) at 20 weeks postinfection (n=5) and age-matched control mice (n=3) were cultured for 48 h in the absence of any mitogenic stimulus, after which secreted levels of PGE2 were measured in the supernatants by ELISA. The bars represent means±S.E.M., P<0.05, Mann–Whitney U test.
Figure 2
Figure 2. Level of expression of COX-2 is increased in lymph nodes of MAIDS-infected mice
Lymph nodes were fixed, plastic-embedded, sectioned and subjected to COX-2 immunohistochemical staining (brown stain). (a) Normal control lymph node with the germinal centre stained for COX-2. (b) Normal lymph node at higher magnification. Note that cells staining positive for HRP-colour reaction (brown colour) are ‘tingible body’ macrophages with dense, ingested material. (c) Lymph node from MAIDS mouse (20 weeks postinfection). Note the altered morphology and architecture. (d) Higher magnification of MAIDS lymph node stained for COX-2. Note that a number of cells have brown immunostaining in the cytoplasm and numerous mitotic figures. Blocking with antigen competed COX-2 staining (not shown). Representative observations from the examination of three pairs of infected and healthy mice are shown.
Figure 3
Figure 3. COX-2-expressing cells are positive for CD11b
Smears of mixed lymph node cells from MAIDS mice were subjected to dual immunofluorescence staining for COX-2 (a, d) and CD11b (b) or Mac-3 (e). As seen in the image overlays (c, f), COX-2-expressing cells were always positive for CD11b, whereas a subpopulation of COX-2-positive cells were expressing Mac-3.
Figure 4
Figure 4. Expression of COX-2 and COX-1 by different subsets of lymph node lymphocytes in normal and MAIDS-infected mice
Unsorted lymph-node (LN) cells (a) and FACS-sorted CD4+ and CD8+ T-cells, B220+B-cells and negatively selected CD11b cells from normal (a, b, d) and infected (a, c, e) mice were lysed and 10 μg of protein from each sample was subjected to immunoblot analysis for the expression of COX-2 (ac) or Cox-1 (de). Blots were concomitantly reacted with antibodies to actin as control. One of the three experiments with different animals is shown. Blots were analysed by densitometry (www.scion.com) and COX expression was normalized to actin (a′, b′/c′, d′/e′).
Figure 5
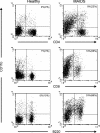
Figure 5. MAIDS lymph node cells have high levels of CD11b
Expression of CD11b by different subsets of lymph node lymphocytes from infected and control mice was analysed by flow cytometry. Representative observations from the examination of three pairs of infected and healthy mice are shown. Numbers in the upper right quadrants refer to the percentage of upper right versus total number of cells and numbers in parentheses refer to the percentage of upper right versus both right quadrants.
Figure 6
Figure 6. Effect of COX-2-specific and non-selective inhibitors on secretion of PGE2 and T-cell immune responses in mixed lymph node cultures ex vivo
(a) Lymph node mononuclear cells (0.3×10⁶ cells/well) from retrovirus-infected mice at 20 weeks postinfection (open bars, n=5) and from a pool of three age-matched control mice (black bars) were cultured for 48 h with and without the COX-2-specific inhibitors rofecoxib (0.125 μM) and celecoxib (0.125 μM). Level of secretion of PGE2 was measured by ELISA in the supernatants. Bars represent means±S.E.M. (b) T-cell proliferative responses were assessed in a mixed population of lymph node mononuclear cells from healthy mice (n=3) in the absence and presence of PGE2. T-cell activation was accomplished by cross-ligation of anti-CD3 (mAb 2C11; 4 g/ml), proliferation was assessed after 72 h culture, during which [3H]thymidine was included for the last 4 h, and data were normalized with regard to proliferative response in infected mice in the absence of any COX inhibitor. The bars represent means±S.E.M. (c) T-cell proliferative responses were assessed in a mixed population of lymph node mononuclear cells from healthy mice (n=3) in the absence and presence of culture supernatant from culture of MAIDS LN cells for 24 h. T-cell activation and proliferation assays were conducted as in (b). The bars represent means±S.E.M., *P<0.05 by Mann–Whitney U test. (d) T-cell proliferative responses were assessed in a mixed population of lymph node mononuclear cells from infected (n=4) and age-matched control mice (n=3) in the absence and presence of indomethacin (50 ng/ml), rofecoxib (0.125 μM), celecoxib (0.125 μM) or meloxicam (2.5 μg/ml). T-cell activation and proliferation assays were conducted as in (b). The bars represent means±S.E.M., *P<0.01 by Mann–Whitney U test.
Figure 7
Figure 7. Effect of in vivo treatment of MAIDS mice with meloxicam on T-cell immune function
(a) Osmotic pumps (Alzet; 100 μl) with meloxicam (release rate of 70 μg·animal−1·day−1) or PBS were implanted subcutaneously in MAIDS mice (14 weeks postinfection) and healthy mice for 14 days. Subsequently, T-cell proliferative responses were assessed in vitro in a mixed population of unsorted lymph node mononuclear cells from meloxicam-treated animals and animals that received PBS by [3H]thymidine incorporation. T-cell activation was accomplished in all samples by cross-ligation of anti-CD3 (mAb 2C11; 4 μg/ml). Cells were cultured for 72 h, during which [3H]thymidine was included for the last 4 h. Mean±S.E.M. for each group is shown. The effect of meloxicam treatment on anti-CD3-stimulated proliferation of cells from MAIDS mice compared with that of MAIDS mice that received PBS is significant (P<0.05). (b) Mixed lymph node cultures from the groups of mice in (a) treated in vivo with meloxicam or PBS and where meloxicam (2.5 μg/ml) was again added to the medium in cell culture in vitro; anti-CD3-induced T-cell proliferation was assessed as in (a), and the effect of adding again meloxicam in vitro was assessed by comparing with the response in cells treated with meloxicam in vivo but with no in vitro addition (P=0.005). (c) Mixed lymph node cultures from the groups of mice in (a) treated in vivo with meloxicam or PBS and where Rp-8-Br-cAMPS (0.5 mM) was added in cell culture in vitro; anti-CD3-induced T-cell proliferation was assessed as in (a), and the effect of Rp-8-Br-cAMPS in vitro was expressed as fold induction above that of cells that received no in vitro addition. (d) MAIDS mice were implanted with osmotic pumps delivering PBS or meloxicam for 2 weeks as in (a), and the proliferative responses (left panel) and weights of peripheral (left middle) and mesenteric (right middle) lymph nodes and spleens (right panel) were analysed.

Similar articles

Cited by

References

    1. Aziz D. C., Hanna Z., Jolicoeur P. Severe immunodeficiency disease induced by a defective murine leukaemia virus. Nature (London) 1989;338:505–508. - PubMed
    1. Mosier D. E., Yetter R. A., Morse H. C., III Functional T lymphocytes are required for a murine retrovirus-induced immunodeficiency disease (MAIDS) J. Exp. Med. 1987;165:1737–1742. - PMC - PubMed
    1. Yetter R. A., Buller R. M., Lee J. S., Elkins K. L., Mosier D. E., Fredrickson T. N., Morse H. C., III CD4+ T cells are required for development of a murine retrovirus-induced immunodeficiency syndrome (MAIDS) J. Exp. Med. 1988;168:623–635. - PMC - PubMed
    1. Cerny A., Hugin A. W., Hardy R. R., Hayakawa K., Zinkernagel R. M., Makino M., Morse H. C., III B cells are required for induction of T cell abnormalities in a murine retrovirus-induced immunodeficiency syndrome. J. Exp. Med. 1990;171:315–320. - PMC - PubMed
    1. Mosier D. E., Yetter R. A., Morse H. C., III Retroviral induction of acute lymphoproliferative disease and profound immunosuppression in adult C57BL/6 mice. J. Exp. Med. 1985;161:766–784. - PMC - PubMed

Publication types

MeSH terms