Comparative Study
. 2004;5(9):R61.
doi: 10.1186/gb-2004-5-9-r61. Epub 2004 Aug 20.

Computational identification of developmental enhancers: conservation and function of transcription factor binding-site clusters in Drosophila melanogaster and Drosophila pseudoobscura

Affiliations
Comparative Study

Computational identification of developmental enhancers: conservation and function of transcription factor binding-site clusters in Drosophila melanogaster and Drosophila pseudoobscura

Benjamin P Berman et al. Genome Biol. 2004.

Abstract

Background: The identification of sequences that control transcription in metazoans is a major goal of genome analysis. In a previous study, we demonstrated that searching for clusters of predicted transcription factor binding sites could discover active regulatory sequences, and identified 37 regions of the Drosophila melanogaster genome with high densities of predicted binding sites for five transcription factors involved in anterior-posterior embryonic patterning. Nine of these clusters overlapped known enhancers. Here, we report the results of in vivo functional analysis of 27 remaining clusters.

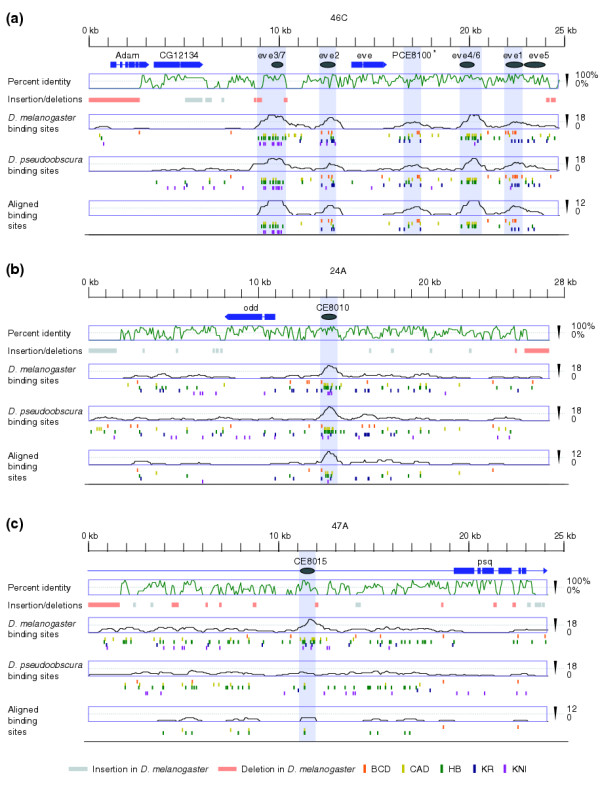
Results: We generated transgenic flies carrying each cluster attached to a basal promoter and reporter gene, and assayed embryos for reporter gene expression. Six clusters are enhancers of adjacent genes: giant, fushi tarazu, odd-skipped, nubbin, squeeze and pdm2; three drive expression in patterns unrelated to those of neighboring genes; the remaining 18 do not appear to have enhancer activity. We used the Drosophila pseudoobscura genome to compare patterns of evolution in and around the 15 positive and 18 false-positive predictions. Although conservation of primary sequence cannot distinguish true from false positives, conservation of binding-site clustering accurately discriminates functional binding-site clusters from those with no function. We incorporated conservation of binding-site clustering into a new genome-wide enhancer screen, and predict several hundred new regulatory sequences, including 85 adjacent to genes with embryonic patterns.

Conclusions: Measuring conservation of sequence features closely linked to function--such as binding-site clusterin--makes better use of comparative sequence data than commonly used methods that examine only sequence identity.


Figures

Figure 1
Figure 1
Expression patterns of active pCRMs. Embryonic whole-mount in situ RNA hybridizations using lacZ probe of transgenes with positive expression in independent lines (see Materials and methods). The first column (wild type) shows the endogenous gene expression; the second column (lacZ) shows transgene expression patterns; the third column shows double-labeled embryos with the endogenous (red) and transgene (blue) expression patterns. To the right of the images are maps of the gene regions centered on each pCRM.
Figure 2
Figure 2
Predicted and aligned binding sites in pCRMs. Predicted binding sites and aligned binding sites (see Materials and methods) in positive, ambiguous and negative pCRMs (the positions of overlapping sites were adjusted slightly so that all sites could be seen).
Figure 3
Figure 3
Binding-site conservation, but not sequence conservation, correlates with pCRM activity. Three 25-kb regions were chosen to illustrate patterns of sequence conservation and binding-site conservation. (a)even-skipped (eve) contains five previously known segmentation enhancers (labeled eve3/7, eve2, eve4/6, eve1, and eve5); (b)odd-skipped (odd) contains a single functional (positive) pCRM (CE8010); and (c)pipsqueak (psq) contains a non-functional (negative) pCRM (CE8015). Annotated genes are shown in blue, and the direction of transcription is indicated by the arrow. Gray ovals indicate experimentally tested fragments, and shaded gray boxes show the extent of pCRMs as defined by CIS-ANALYST (minimum of 13 sites within a 700 bp window). The green graphs show average percent identity (in 100-bp windows). Below the percent identity plots are shown insertions (gray boxes) and deletions (orange boxes) of 80 or more bp in the D. melanogaster sequence relative to their D. pseudoobscura ortholog. The location of binding sites in D. melanogaster, binding sites in D. pseudoobscura and aligned binding sites along with the average density of sites (700-bp windows) are shown in the bottom three panels for each region. * in (a) indicates a new prediction (PCE8100).
Figure 4
Figure 4
Conservation of clustering distinguishes positive and negative pCRMs. Each panel compares positive, negative and ambiguous pCRMs and random 1,000-bp non-coding regions based on (a) binding site density in D. melanogaster, (b) percent identity, (c) density of aligned sites, and (d) density of aligned plus preserved sites. The top portion of each panel contains a histogram of the values for randomly chosen 1,000-bp regions of the D. melanogaster genome. The blue line plots the cumulative distribution. The colored asterisks show the average values for each class of pCRM. The unshaded panel below the histogram shows the values for each pCRM (each dot represents one pCRM, with positives in blue, negatives in red, ambiguous in green). The shaded panel at the bottom shows the average value for 1,000-bp non-coding sequences within 20 kb of each pCRM.
Figure 5
Figure 5
Inclusion of evolutionary information greatly increases the specificity and selectivity of CRM searches based on binding-site clustering. The effects of integrating comparative data into searches for binding site clusters were assessed by counting the number of (a) true positive, (b) negative and (c) novel CRMs recovered at the different site density cutoffs plotted on the x-axis. The positives used here include the 15 positive pCRMs from Table 2 and 10 additional positive CRMs from the literature (see text), all of which have identifiably orthologous sequence in D. pseudoobscura, while the negatives included only the 14 non-functional pCRMs for which orthologous sequence in D. pseudoobscura could be found. The solid line in each panel shows the results without the use of D. pseudoobscura; the dashed line shows the results with D. pseudoobscura. Searches displayed were performed using the aligned sites constraint (see Materials and methods). Comparable results were obtained for the aligned + preserved sites constraint. The number of false positives is not strictly monotonically decreasing with an increasing binding site cutoff. This stems from the cluster merging behavior of CIS-ANALYST - sometimes a decrease in the minimum number of sites leads CIS-ANALYST to tack on a lower-density cluster that is adjacent to a higher-density one, resulting in a single cluster with more sites but lower site density. This can actually increase the number of conserved sites necessary to reach the conservation threshold (see Materials and methods).
Figure 6
Figure 6
Expression patterns of genes adjacent to high-scoring pCRMs. Wild-type embryonic expression patterns of 36 genes adjacent to 53 pCRMs identified by eCIS-ANALYST (see Tables 3 and 4). The images were obtained from the BDGP Embryonic Expression Pattern Database [33], and include all pCRMs from Tables 3 and 4 for which an adjacent gene had an early segmentation pattern.

References

    1. Arnone MI, Davidson EH. The hardwiring of development: organization and function of genomic regulatory systems. Development. 1997;124:1851–1864. - PubMed
    1. Levine M, Tjian R. Transcription regulation and animal diversity. Nature. 2003;424:147–151. doi: 10.1038/nature01763. - DOI - PubMed
    1. The C. elegans Sequencing Consortium Genome sequence of the nematode C. elegans: a platform for investigating biology. Science. 1998;282:2012–2018. doi: 10.1126/science.282.5396.2012. - DOI - PubMed
    1. Venter JC, Adams MD, Myers EW, Li PW, Mural RJ, Sutton GG, Smith HO, Yandell M, Evans CA, Holt RA, et al. The sequence of the human genome. Science. 2001;291:1304–1351. doi: 10.1126/science.1058040. - DOI - PubMed
    1. Lander ES, Linton LM, Birren B, Nusbaum C, Zody MC, Baldwin J, Devon K, Dewar K, Doyle M, FitzHugh W, et al. Initial sequencing and analysis of the human genome. Nature. 2001;409:860–921. doi: 10.1038/35057062. - DOI - PubMed

Publication types

MeSH terms