. 2004 Sep;70(9):5323-30.
doi: 10.1128/AEM.70.9.5323-5330.2004.

Role of hexose transport in control of glycolytic flux in Saccharomyces cerevisiae

Affiliations

Role of hexose transport in control of glycolytic flux in Saccharomyces cerevisiae

Karin Elbing et al. Appl Environ Microbiol. 2004 Sep.

Abstract

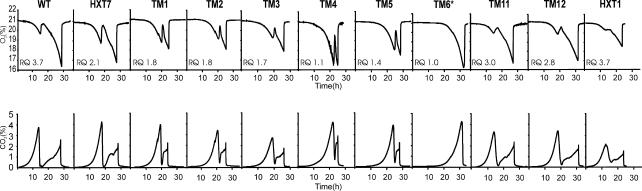
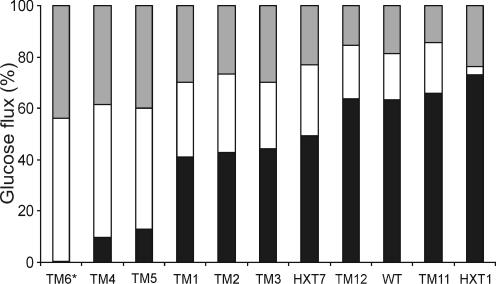
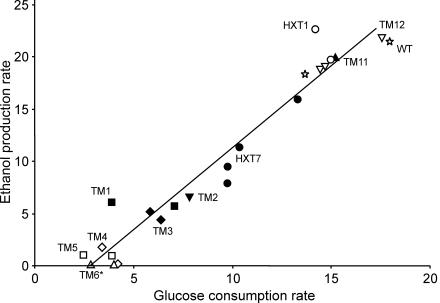
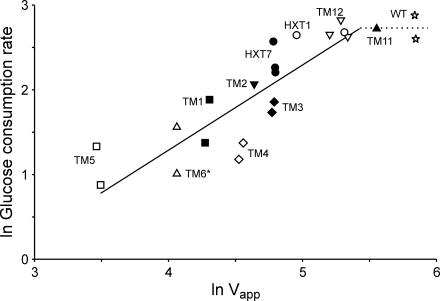
The yeast Saccharomyces cerevisiae predominantly ferments glucose to ethanol at high external glucose concentrations, irrespective of the presence of oxygen. In contrast, at low external glucose concentrations and in the presence of oxygen, as in a glucose-limited chemostat, no ethanol is produced. The importance of the external glucose concentration suggests a central role for the affinity and maximal transport rates of yeast's glucose transporters in the control of ethanol production. Here we present a series of strains producing functional chimeras between the hexose transporters Hxt1 and Hxt7, each of which has distinct glucose transport characteristics. The strains display a range of decreasing glycolytic rates resulting in a proportional decrease in ethanol production. Using these strains, we show for the first time that at high glucose levels, the glucose uptake capacity of wild-type S. cerevisiae does not control glycolytic flux during exponential batch growth. In contrast, our chimeric Hxt transporters control the rate of glycolysis to a high degree. Strains whose glucose uptake is mediated by these chimeric transporters will undoubtedly provide a powerful tool with which to examine in detail the mechanism underlying the switch between fermentation and respiration in S. cerevisiae and will provide new tools for the control of industrial fermentations.


Figures

FIG. 1.
FIG. 1.
Oxygen consumption and carbon dioxide production (both expressed as percentages) during aerobic batch cultivations, with glucose as the sole carbon and energy source, of the wild-type (WT), HXT1, HXT7, TM1, TM2, TM3, TM4, TM5, TM6*, TM11, and TM12 strains. Maximal RQ values in the glucose consumption phase were calculated from typical experiments.
FIG. 2.
FIG. 2.
Yield distributions based on carbon balance (expressed as percentages). See the legend to Fig. 1 for strain explanations. Solid bars, ethanol and carbon dioxide produced by fermentation; open bars, carbon dioxide produced by respiration plus glycerol and other by-products including acetate (calculated as the difference between the total amount of glucose consumed and that converted into ethanol, carbon dioxide, and biomass); shaded bars, biomass. All data were obtained during the maximal-production period in the respirofermentative glucose consumption phase for all strains except the TM6* strain (which displays only a single phase).
FIG. 3.
FIG. 3.
Plot of the maximal specific ethanol production rate (expressed as millimoles of ethanol per gram [dry weight] per hour) versus the maximal specific glucose consumption rate (expressed as millimoles of glucose per gram [dry weight] per hour) of independent batches for the wild-type (WT) (open star), HXT1 (open circles), HXT7 (solid circles), TM1 (solid squares), TM2 (solid inverted triangles), TM3 (solid diamonds), TM4 (open diamonds), TM5 (open squares), TM6* (open triangles), TM11 (solid triangles), and TM12 (open inverted triangles) strains. All data were obtained during the maximal production period in the respirofermentative phase for all strains except the TM6* strain (which displays only a single phase).
FIG. 4.
FIG. 4.
Double logarithmic plot of the maximum specific glucose consumption rate (expressed as millimoles of glucose per gram [dry weight] per hour) versus the apparent glucose uptake rate (Vapp, expressed as nanomoles of glucose per milligram of protein per minute). For strain and symbol explanations, see the legend to Fig. 3. All data were calculated during the respirofermentative phase, except for the TM6* strain (which displays only a single phase).
FIG. 5.
FIG. 5.
Double-logarithmic plot of glycolytic flux, JGlc (maximum specific glucose consumption rate, expressed as nanomoles of glucose per milligram of protein per minute) versus adjusted glucose transport activity, Vadj (expressed as nanomoles per milligram of protein per minute). The protein content was assumed to be 0.5 g (g [dry weight])−1, and the intracellular glucose concentration was assumed to be 0 mM. For strain and symbol explanations, see the legend to Fig. 3. Values for all strains except the TM6* strain (which displays only a single phase) were calculated during the respirofermentative phase.

References

    1. Bisson, L. F., D. M. Coons, A. L. Kruckeberg, and D. A. Lewis. 1993. Yeast sugar transporters. Crit. Rev. Biochem. Mol. Biol. 28:259-308. - PubMed
    1. Bisson, L. F., and D. G. Fraenkel. 1983. Involvement of kinases in glucose and fructose uptake by Saccharomyces cerevisiae. Proc. Natl. Acad. Sci. USA 80:1730-1734. - PMC - PubMed
    1. Blazquez, M. A., R. Lagunas, C. Gancedo, and J. M. Gancedo. 1993. Trehalose-6-phosphate, a new regulator of yeast glycolysis that inhibits hexokinases. FEBS Lett. 329:51-54. - PubMed
    1. Boeke, J. D., F. LaCroute, and G. R. Fink. 1984. A positive selection for mutants lacking orotidine-5′-phosphate decarboxylase activity in yeast: 5-fluoro-orotic acid resistance. Mol. Gen. Genet. 197:345-346. - PubMed
    1. Boles, E., and C. P. Hollenberg. 1997. The molecular genetics of hexose transport in yeasts. FEMS Microbiol. Rev. 21:85-111. - PubMed

Publication types

LinkOut - more resources