Multicenter Study
. 2005 Apr;64(4):575-81.
doi: 10.1136/ard.2004.027672. Epub 2004 Sep 2.

Interleukin 10 promoter microsatellite polymorphisms are associated with response to long term treatment with etanercept in patients with rheumatoid arthritis

Affiliations
Multicenter Study

Interleukin 10 promoter microsatellite polymorphisms are associated with response to long term treatment with etanercept in patients with rheumatoid arthritis

H Schotte et al. Ann Rheum Dis. 2005 Apr.

Abstract

Objectives: To analyse the association of interleukin 10 (IL10) promoter polymorphisms, which have been shown to be related to IL10 secretion capacity, with the response to long term treatment with etanercept in patients with rheumatoid arthritis (RA).

Methods: Fifty patients with active RA were treated for up to 4 years (median 39 months, range 3-52) with stable doses of etanercept as monotherapy. Treatment response was assessed as defined by the EULAR criteria in an intention to treat analysis, with the last observation carried forward. IL10 promoter microsatellite polymorphisms IL10.R and IL10.G were genotyped by fragment length analysis in patients and 189 healthy controls matched for ethnicity, age, and sex. Haplotypes were reconstructed using a method based on bayesian, coalescent theory with the PHASE software.

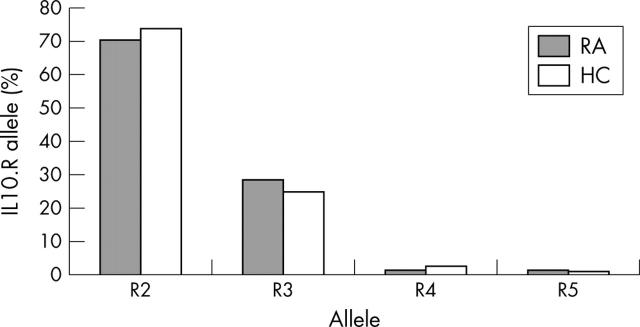
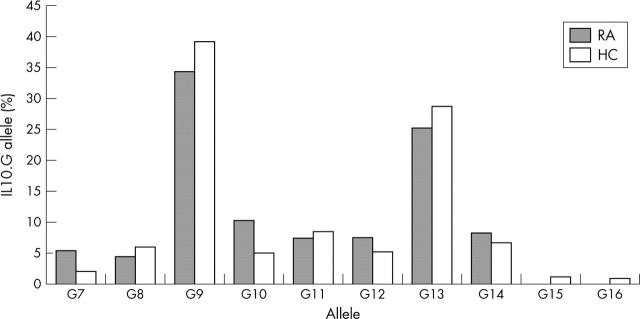
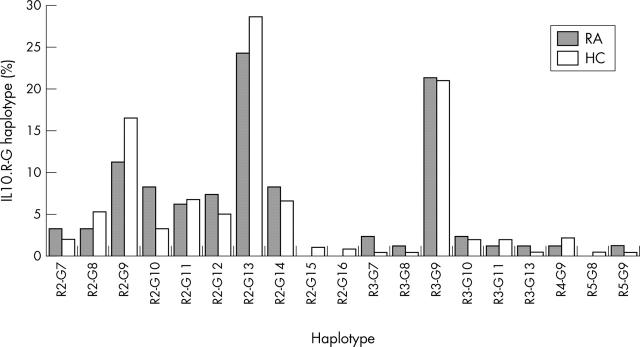
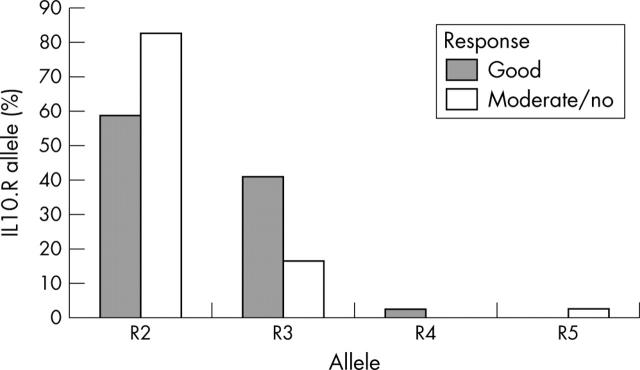
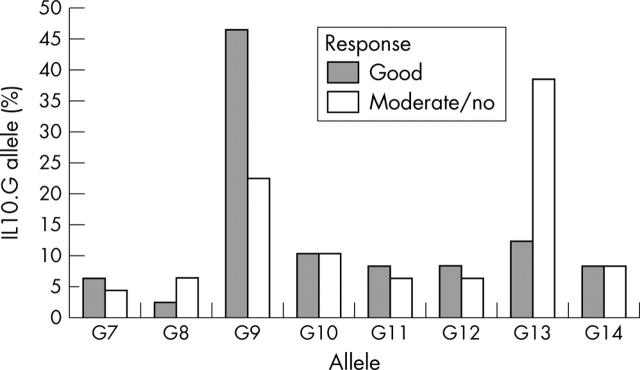
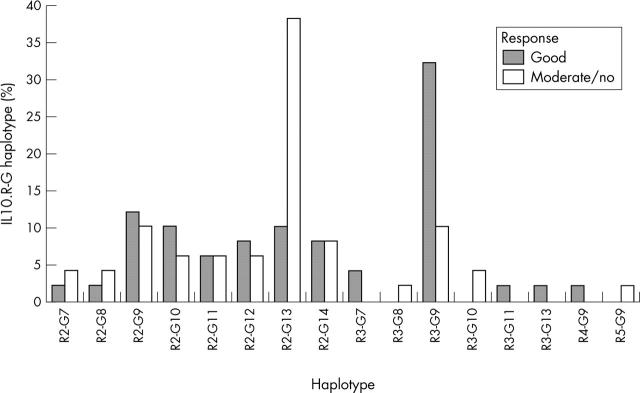
Results: IL10 microsatellite polymorphisms were not associated with susceptibility to RA. When patients with good treatment response (n = 25) were compared with patients with moderate (n = 17) or no response (n = 8), a significantly different distribution of the prevailing alleles R2, R3 and G9, G13, respectively, became evident. Good treatment response was associated with carriage of the R3 allele or R3-G9 haplotype, whereas the allele G13 and the haplotype R2-G13 predominated in patients with moderate or no response.

Conclusion: Genotyping of the IL10 promoter microsatellites may be useful in predicting the clinical response to etanercept in patients with RA. The high prevalence of the presumptive IL10 low producer allele R3 in patients with a favourable response suggests that IL10 promotes disease activity in RA under the specific condition of tumour necrosis factor antagonism.


Figures

Figure 1
Figure 1
IL10.R allele distribution in patients with RA and healthy controls (HC). Bars represent the allele frequencies in the respective population. Allele distribution was not significantly different between patients with RA (n = 100 alleles) and healthy controls (n = 378 alleles). χ2 (T4 statistics) = 0.62; p = 0.2232.
Figure 2
Figure 2
IL10.G allele distribution in patients with RA and healthy controls (HC). Bars represent the allele frequencies in the respective population. Allele distribution was not significantly different between patients with RA (n = 100 alleles) and healthy controls (n = 378 alleles). χ2 (T4 statistics) = 8.09; p = 0.1684.
Figure 3
Figure 3
IL10.R-G haplotype distribution in patients with RA and healthy controls (HC). Bars represent the haplotype frequencies in the respective population. Haplotype distribution was not significantly different between patients with RA (n = 100 alleles) and healthy controls (n = 378 alleles). χ2 (T4 statistics) = 12.08; p = 0.2140.
Figure 4
Figure 4
IL10.R allele distribution in patients with RA as related to etanercept response. Bars represent the allele frequencies in the respective patient subgroup. Allele distribution was significantly different between patients responding well to etanercept treatment (n = 50 alleles) and patients responding moderately or not at all (n = 50 alleles). χ2 (T4 statistics) = 8.21; p = 0.0101.
Figure 5
Figure 5
IL10.G allele distribution in patients with RA as related to etanercept response. Bars represent the allele frequencies in the respective patient subgroup. Allele distribution was significantly different between patients responding well to etanercept treatment (n = 50 alleles) and patients responding moderately or not at all (n = 50 alleles). χ2 (T4 statistics) = 10.93; p = 0.0346.
Figure 6
Figure 6
IL10.R-G haplotype distribution in patients with RA as related to etanercept response. Bars represent the haplotype frequencies in the respective patient subgroup. Haplotype distribution was significantly different between patients responding well to etanercept treatment (n = 50 alleles) and patients responding moderately or not at all (n = 50 alleles). χ2 (T4 statistics) = 17.83; p = 0.0186.

Similar articles

Cited by

References

    1. Annu Rev Immunol. 1996;14:397-440 - PubMed
    1. Immunogenetics. 1996;45(1):82-3 - PubMed
    1. Lancet. 1997 Jan 18;349(9046):170-3 - PubMed
    1. Immunogenetics. 1997;46(2):120-8 - PubMed
    1. Am J Pathol. 1997 Nov;151(5):1311-9 - PubMed

Publication types

MeSH terms