Michaelis-Menten kinetics under spatially constrained conditions: application to mibefradil pharmacokinetics
- PMID: 15345531
- PMCID: PMC1304557
- DOI: 10.1529/biophysj.104.042143
Michaelis-Menten kinetics under spatially constrained conditions: application to mibefradil pharmacokinetics
Abstract
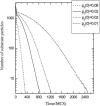
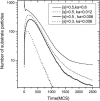
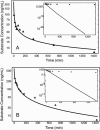
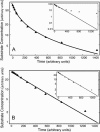
Two different approaches were used to study the kinetics of the enzymatic reaction under heterogeneous conditions to interpret the unusual nonlinear pharmacokinetics of mibefradil. Firstly, a detailed model based on the kinetic differential equations is proposed to study the enzymatic reaction under spatial constraints and in vivo conditions. Secondly, Monte Carlo simulations of the enzyme reaction in a two-dimensional square lattice, placing special emphasis on the input and output of the substrate were applied to mimic in vivo conditions. Both the mathematical model and the Monte Carlo simulations for the enzymatic reaction reproduced the classical Michaelis-Menten (MM) kinetics in homogeneous media and unusual kinetics in fractal media. Based on these findings, a time-dependent version of the classic MM equation was developed for the rate of change of the substrate concentration in disordered media and was successfully used to describe the experimental plasma concentration-time data of mibefradil and derive estimates for the model parameters. The unusual nonlinear pharmacokinetics of mibefradil originates from the heterogeneous conditions in the reaction space of the enzymatic reaction. The modified MM equation can describe the pharmacokinetics of mibefradil as it is able to capture the heterogeneity of the enzymatic reaction in disordered media.
Figures


Similar articles
-
Fractal michaelis-menten kinetics under steady state conditions: Application to mibefradil.Pharm Res. 2006 Dec;23(12):2760-7. doi: 10.1007/s11095-006-9090-6. Epub 2006 Oct 25. Pharm Res. 2006. PMID: 17063399
-
Monte carlo simulations of enzyme reactions in two dimensions: fractal kinetics and spatial segregation.Biophys J. 2002 Oct;83(4):1891-901. doi: 10.1016/S0006-3495(02)73953-2. Biophys J. 2002. PMID: 12324410 Free PMC article.
-
Monte Carlo simulations of enzymatic reactions in crowded media. Effect of the enzyme-obstacle relative size.Math Biosci. 2014 May;251:72-82. doi: 10.1016/j.mbs.2014.03.012. Epub 2014 Mar 26. Math Biosci. 2014. PMID: 24680707
-
A review of basic principles of fractals and their application to pharmacokinetics.Q J Nucl Med Mol Imaging. 2008 Sep;52(3):278-88. Q J Nucl Med Mol Imaging. 2008. PMID: 18551095 Review.
-
Validity of the Michaelis-Menten equation--steady-state or reactant stationary assumption: that is the question.FEBS J. 2014 Jan;281(2):464-72. doi: 10.1111/febs.12564. Epub 2013 Nov 18. FEBS J. 2014. PMID: 24245583 Review.
Cited by
-
Advanced pharmacokinetic models based on organ clearance, circulatory, and fractal concepts.AAPS J. 2007 Jun 29;9(2):E268-83. doi: 10.1208/aapsj0902030. AAPS J. 2007. PMID: 17907768 Free PMC article. Review.
-
Fractal michaelis-menten kinetics under steady state conditions: Application to mibefradil.Pharm Res. 2006 Dec;23(12):2760-7. doi: 10.1007/s11095-006-9090-6. Epub 2006 Oct 25. Pharm Res. 2006. PMID: 17063399
-
A new approach to the compartmental analysis in pharmacokinetics: fractional time evolution of diclofenac.J Pharmacokinet Pharmacodyn. 2010 Apr;37(2):119-34. doi: 10.1007/s10928-009-9147-3. Epub 2010 Jan 14. J Pharmacokinet Pharmacodyn. 2010. PMID: 20072802
-
Application of modified Michaelis - Menten equations for determination of enzyme inducing and inhibiting drugs.BMC Pharmacol Toxicol. 2021 Oct 11;22(1):57. doi: 10.1186/s40360-021-00521-x. BMC Pharmacol Toxicol. 2021. PMID: 34635182 Free PMC article.
-
Monte Carlo simulations in drug release.J Pharmacokinet Pharmacodyn. 2019 Apr;46(2):165-172. doi: 10.1007/s10928-019-09625-8. Epub 2019 Mar 18. J Pharmacokinet Pharmacodyn. 2019. PMID: 30880356 Review.
References
-
- Agutter, P., P. Malone, and D. Wheatley. 1995. Intracellular transport mechanism: a critique of diffusion theory. J. Theor. Biol. 176:261–272. - PubMed
-
- Argyrakis, P., R. Kopelman, and K. Lindenberg. 1993. Diffusion-limited binary reactions: the hierarchy of nonclassical regimes for random initial conditions. Chem. Phys. 177:85032–85034.
-
- Bonny, J. D., and H. Leuenberger. 1991. Matrix type controlled release systems. I. Effect of percolation on drug dissolution kinetics. Pharm. Acta Helv. 66:160–164. - PubMed
-
- Bonny, J. D., and H. Leuenberger. 1993. Matrix type controlled release systems. II. Percolation effects in non-swellable matrices. Pharm. Acta Helv. 68:25–33. - PubMed
Publication types
MeSH terms
Substances
LinkOut - more resources
Full Text Sources

