

Kinetics of target site localization of a protein on DNA: a stochastic approach
- PMID: 15345543
- PMCID: PMC1304569
- DOI: 10.1529/biophysj.104.045773
Kinetics of target site localization of a protein on DNA: a stochastic approach
Abstract
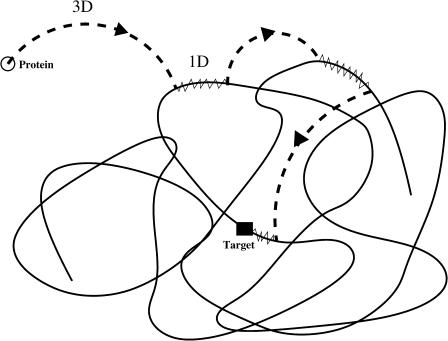
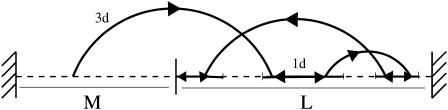
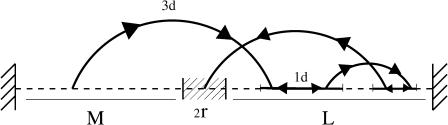
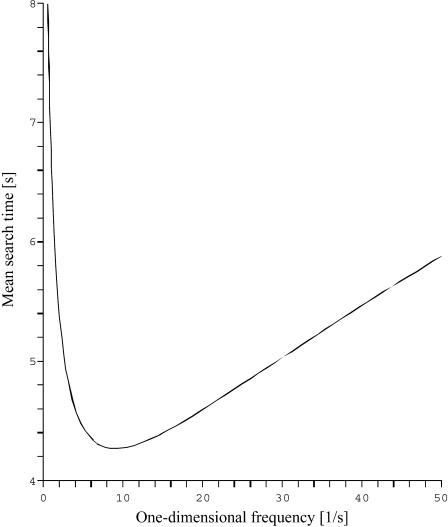
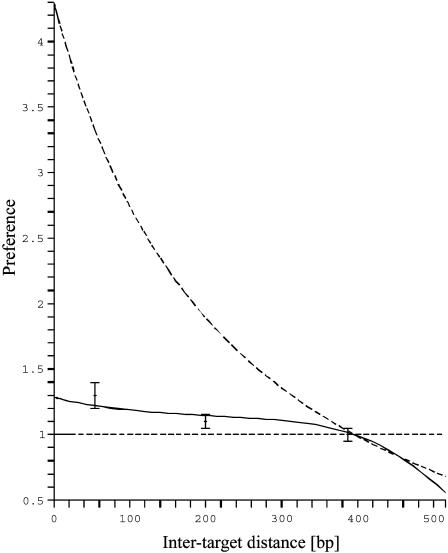
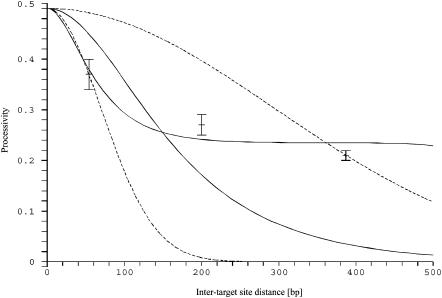
It is widely recognized that the cleaving rate of a restriction enzyme on target DNA sequences is several orders-of-magnitude faster than the maximal one calculated from the diffusion-limited theory. It was therefore commonly assumed that the target site interaction of a restriction enzyme with DNA has to occur via two steps: one-dimensional diffusion along a DNA segment, and long-range jumps coming from association-dissociation events. We propose here a stochastic model for this reaction which comprises a series of one-dimensional diffusions of a restriction enzyme on nonspecific DNA sequences interrupted by three-dimensional excursions in the solution until the target sequence is reached. This model provides an optimal finding strategy which explains the fast association rate. Modeling the excursions by uncorrelated random jumps, we recover the expression of the mean time required for target site association to occur given by Berg et al. in 1981, and we explicitly give several physical quantities describing the stochastic pathway of the enzyme. For competitive target sites we calculate two quantities: processivity and preference. By comparing these theoretical expressions to recent experimental data obtained for EcoRV-DNA interaction, we quantify: 1), the mean residence time per binding event of EcoRV on DNA for a representative one-dimensional diffusion coefficient; 2), the average lengths of DNA scanned during the one-dimensional diffusion (during one binding event and during the overall process); and 3), the mean time and the mean number of visits needed to go from one target site to the other. Further, we evaluate the dynamics of DNA cleavage with regard to the probability for the restriction enzyme to perform another one-dimensional diffusion on the same DNA substrate following a three-dimensional excursion.
Figures
Similar articles
-
Quantifying hopping and jumping in facilitated diffusion of DNA-binding proteins.Phys Rev Lett. 2009 May 8;102(18):188101. doi: 10.1103/PhysRevLett.102.188101. Epub 2009 May 4. Phys Rev Lett. 2009. PMID: 19518914
-
Kinetic characterization of linear diffusion of the restriction endonuclease EcoRV on DNA.Biochemistry. 1998 Feb 24;37(8):2160-9. doi: 10.1021/bi9719206. Biochemistry. 1998. PMID: 9485362
-
Molecular enzymology of the EcoRV DNA-(Adenine-N (6))-methyltransferase: kinetics of DNA binding and bending, kinetic mechanism and linear diffusion of the enzyme on DNA.J Mol Biol. 2000 Oct 13;303(1):93-110. doi: 10.1006/jmbi.2000.4127. J Mol Biol. 2000. PMID: 11021972
-
How do site-specific DNA-binding proteins find their targets?Nucleic Acids Res. 2004 Jun 3;32(10):3040-52. doi: 10.1093/nar/gkh624. Print 2004. Nucleic Acids Res. 2004. PMID: 15178741 Free PMC article. Review.
-
An end to 40 years of mistakes in DNA-protein association kinetics?Biochem Soc Trans. 2009 Apr;37(Pt 2):343-8. doi: 10.1042/BST0370343. Biochem Soc Trans. 2009. PMID: 19290859 Review.
Cited by
-
Target search of N sliding proteins on a DNA.Biophys J. 2005 Aug;89(2):895-902. doi: 10.1529/biophysj.104.057612. Epub 2005 May 20. Biophys J. 2005. PMID: 15908574 Free PMC article.
-
How gene order is influenced by the biophysics of transcription regulation.Proc Natl Acad Sci U S A. 2007 Aug 28;104(35):13948-53. doi: 10.1073/pnas.0700672104. Epub 2007 Aug 20. Proc Natl Acad Sci U S A. 2007. PMID: 17709750 Free PMC article.
-
A model for the mediation of processivity of DNA-targeting proteins by nonspecific binding: dependence on DNA length and presence of obstacles.Biophys J. 2005 Mar;88(3):1608-15. doi: 10.1529/biophysj.104.052688. Epub 2004 Dec 13. Biophys J. 2005. PMID: 15596498 Free PMC article.
-
Physical limits on cooperative protein-DNA binding and the kinetics of combinatorial transcription regulation.Biophys J. 2011 Oct 5;101(7):1569-79. doi: 10.1016/j.bpj.2011.08.041. Biophys J. 2011. PMID: 21961582 Free PMC article.
-
How proteins search for their specific sites on DNA: the role of DNA conformation.Biophys J. 2006 Apr 15;90(8):2731-44. doi: 10.1529/biophysj.105.078162. Epub 2006 Feb 3. Biophys J. 2006. PMID: 16461402 Free PMC article.
References
-
- Berg, O. G., and C. Blomberg. 1976. Association kinetics with coupled diffusional flows. Special application to the lac repressor-operator system. Biophys. Chem. 4:367–381. - PubMed
-
- Berg, O. G., and C. Blomberg. 1977. Association kinetics with coupled diffusion. An extension to coiled-chain macromolecules applied to the lac repressor-operator system. Biophys. Chem. 7:33–39. - PubMed
-
- Berg, O. G., and C. Blomberg. 1978. Association kinetics with coupled diffusion. III. Ionic-strength dependence of the lac repressor-operator association. Biophys. Chem. 8:271–280. - PubMed
-
- Berg, O. G., R. B. Winter, and P. H. von Hippel. 1981. Diffusion-driven mechanisms of protein translocation on nucleic acids. I. Models and theory. Biochemistry. 20:6929–6948. - PubMed
-
- Erskine, S. G., G. S. Baldwin, and S. E. Halford. 1997. Rapid-reaction analysis of plasmid DNA cleavage by the EcoRV restriction endonuclease. Biochemistry. 36:7567–7576. - PubMed
MeSH terms
Substances
LinkOut - more resources
Full Text Sources
