. 2004 Sep;87(3):1657-71.
doi: 10.1529/biophysj.103.037531.

Model-based fitting of single-channel dwell-time distributions

Affiliations

Model-based fitting of single-channel dwell-time distributions

Feng Qin et al. Biophys J. 2004 Sep.

Abstract

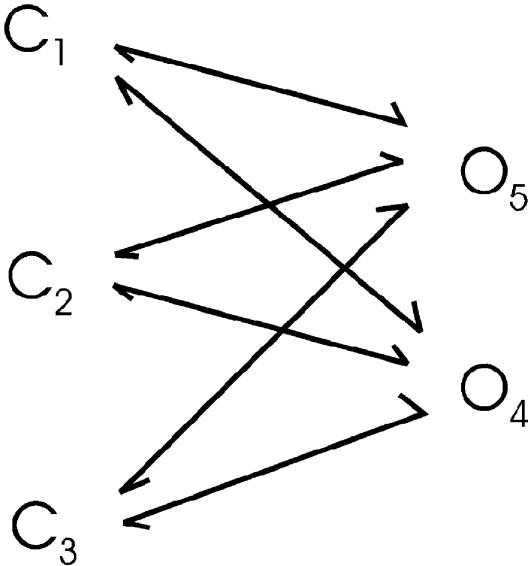
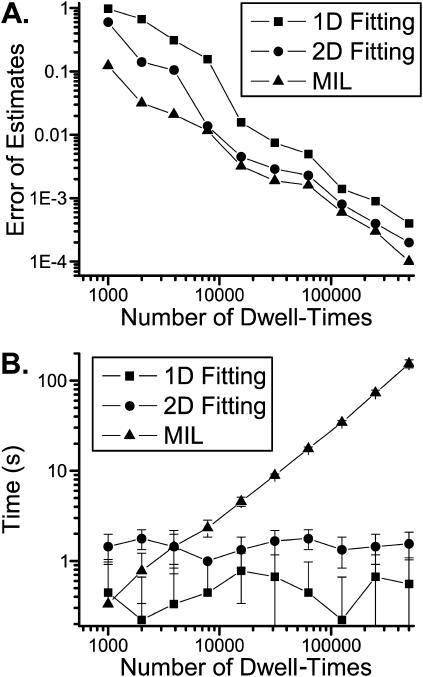
Single-channel recordings provide unprecedented resolutions on kinetics of conformational changes of ion channels. Several approaches exist for analysis of the data, including the dwell-time histogram fittings and the full maximal-likelihood approaches that fit either the idealized dwell-time sequence or more ambitiously the noisy data directly using hidden Markov modeling. Although the full maximum likelihood approaches are statistically advantageous, they can be time-consuming especially for large datasets and/or complex models. We present here an alternative approach for model-based fitting of one-dimensional and two-dimensional dwell-time histograms. To improve performance, we derived analytical expressions for the derivatives of one-dimensional and two-dimensional dwell-time distribution functions and employed the gradient-based variable metric method for fast search of optimal rate constants in a model. The algorithm also has the ability to allow for a first-order correction for the effects of missed events, global fitting across different experimental conditions, and imposition of typical constraints on rate constants including microscopic reversibility. Numerical examples are presented to illustrate the performance of the algorithm, and comparisons with the full maximum likelihood fitting are discussed.


Figures

SCHEME I
SCHEME I
FIGURE 1
FIGURE 1
Histogram analysis of a linear sequential model. The one-dimensional histogram fitting sufficed to resolve the model (A), but it is less sustainable to missed events (B) than the two-dimensional histogram fitting (C). The imposition of a dead time had the most profound effect on the short closures (the leftmost peak in the solid histograms). The openings remained a single exponential, but the mean time increased. Data were simulated from the nicotinic ACh receptor ion channel in Scheme I. The solid lines show the overall distributions predicted from the estimated models, and the dotted lines represent the individual components.
FIGURE 2
FIGURE 2
Models that cannot be discriminated by one-dimensional dwell-time distributions can be resolved by high-order dwell-time distributions, but they may remain as local maximum solutions. (A) The two-dimensional dwell-time distribution predicted from Scheme II for Ca2+-activated potassium channels. The existence of coupling between closed and open dwell-times is evident from the different appearances of the one-dimensional open dwell-time distributions in adjacency to different closed durations. (B) Contours of the likelihood surface at the true solution (top) and a local maximum point (bottom). Each interval corresponds to 918 (top) and 38,835 (bottom) log likelihood units, respectively. The local maximal solution is inferior to the true one by ∼4000 units. The axes represent the logarithms of the ratios of the rates to their true values used in simulation (top) or to their local maximum solutions (bottom). (C) The one-dimensional dwell-time distributions predicted by the local maximal solution. It fits well both closed and open histograms. The dotted lines represent the individual components. A dead time of 40 μs was used for all analysis except for the plot of the theoretical two-dimensional dwell-time distribution in A.
SCHEME II
SCHEME II
SCHEME III
SCHEME III
FIGURE 3
FIGURE 3
Dwell-time histograms and their best one-dimensional and two-dimensional fits (solid lines) for the allosteric model in Scheme III. The dotted lines superimposed on the histograms represent the individual components calculated from the two-dimensional fit. The one-dimensional and two-dimensional fits were virtually identical in the overall distributions. However, they differed in the individual closed components. Most closed components had a negligible occurrence, except the ones that constituted the two major peaks at τ = 0.038 and 52 ms, respectively.
SCHEME IV
SCHEME IV
FIGURE 4
FIGURE 4
Single-channel analysis of a VR1 receptor ion channel. The two-dimensional histograms constructed from three different ligand concentrations were fit simultaneously with a model showing independent ligand binding but partial openings. The solid lines superimposed on the histograms correspond to the one-dimensional dwell-time distributions predicted from the resultant model. The dotted lines represent the individual components. There were a total of 8 closed and 12 open components at each concentration, of which only four closed components exhibited concentration-dependent time constants. The other components including all openings varied in their proportions as the ligand concentration changed. A dead time of 40 μs, corresponding to two sampling durations, was imposed for the analysis.
SCHEME V
SCHEME V
SCHEME VI
SCHEME VI
FIGURE 5
FIGURE 5
Comparisons of the one-dimensional and two-dimensional histogram fittings with the full likelihood fitting of dwell-time sequences. (A) Mean errors of the estimates of parameters. Increasing data length reduced the estimation variances, and the reduction was approximately inversely proportional to the square-root of the number of events. The full likelihood fitting has the least variances among the three approaches, but the differences become relatively insignificant when the number of dwell-times is large. The mean errors are determined by formula image where n is the number of rates, q-values are the true values of the rates used in simulation, and formula image-values are the corresponding estimates. (B) Computational times of the fittings. The histogram fittings had a complexity virtually independent of data length, whereas the full likelihood approach increased proportionally. Analysis was based on data simulated from the five-state model for Ca2+-activated K+ channels in Scheme II. A dead time td = 40 μs was used throughout all tests. Results were averaged from 10 independent data sets, which were generated with different random seeds.

Similar articles

Cited by

References

    1. Ball, F. G., and M. S. P. Sansom. 1989. Ion-channel gating mechanisms: model identification and parameter estimation from single channel recordings. Proc. R. Soc. Lond. B Biol. Sci. 236:385–416. - PubMed
    1. Blatz, A. L., and K. L. Magleby. 1986. Correcting single channel data for missed events. Biophys. J. 49:967–980. - PMC - PubMed
    1. Colquhoun, D., C. J. Hatton, and A. G. Hawkes. 2003. The quality of maximum likelihood estimates of ion channel rate constants. J. Physiol. 547:699–728. - PMC - PubMed
    1. Colquhoun, D., and A. G. Hawkes. 1982. On the stochastic properties of bursts of single ion channel openings and of clusters of bursts. Philos. Trans. R. Soc. Lond. B Biol. Sci. 300:1–59. - PubMed
    1. Colquhoun, D., A. G. Hawkes, and K. Srodzinski. 1996. Joint distributions of apparent open and shut times of single-ion channels and maximum likelihood fitting of mechanisms. Philos. Trans. R. Soc. Lond. A Math. Phys. Eng. Sci. 354:2555–2590.

Publication types

Substances

LinkOut - more resources