. 2004 Sep;87(3):1784-94.
doi: 10.1529/biophysj.103.039131.

Cardiac length dependence of force and force redevelopment kinetics with altered cross-bridge cycling

Affiliations

Cardiac length dependence of force and force redevelopment kinetics with altered cross-bridge cycling

Bishow B Adhikari et al. Biophys J. 2004 Sep.

Abstract

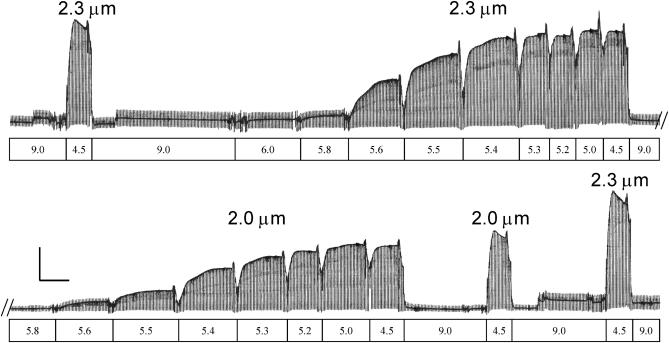
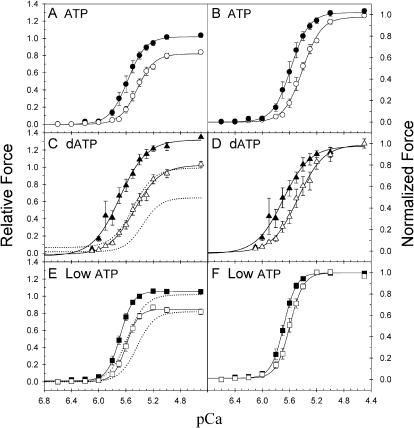
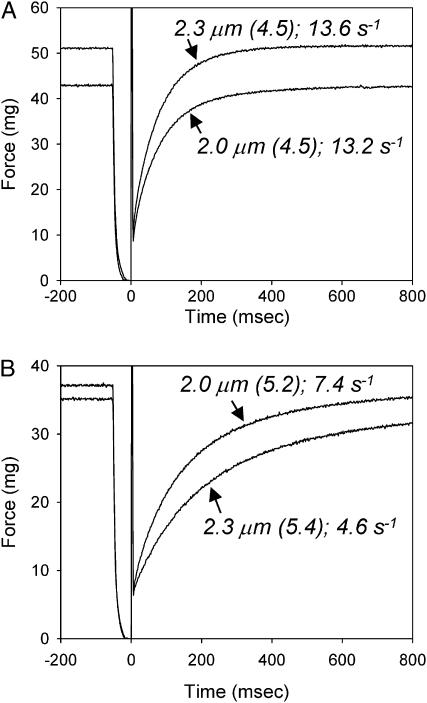
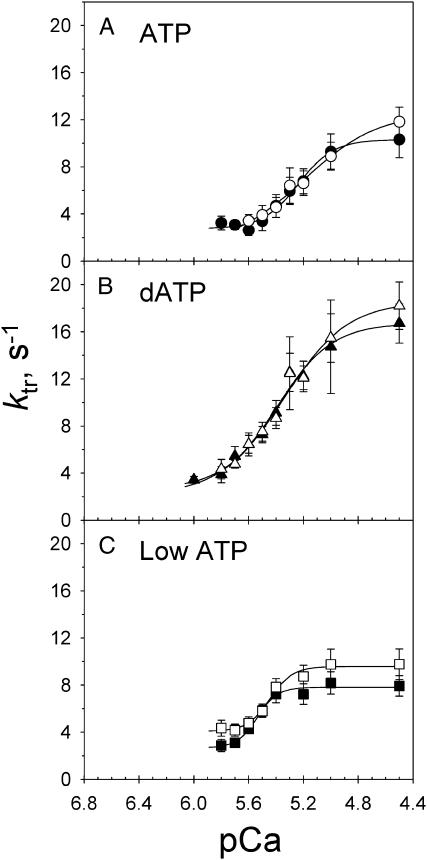
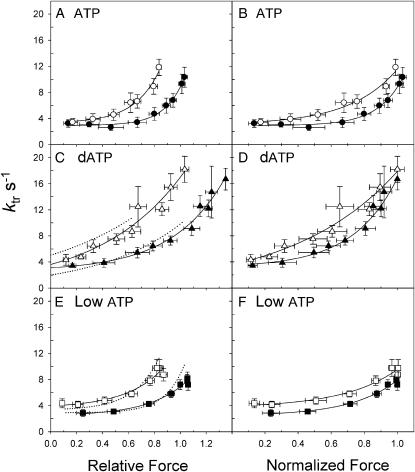
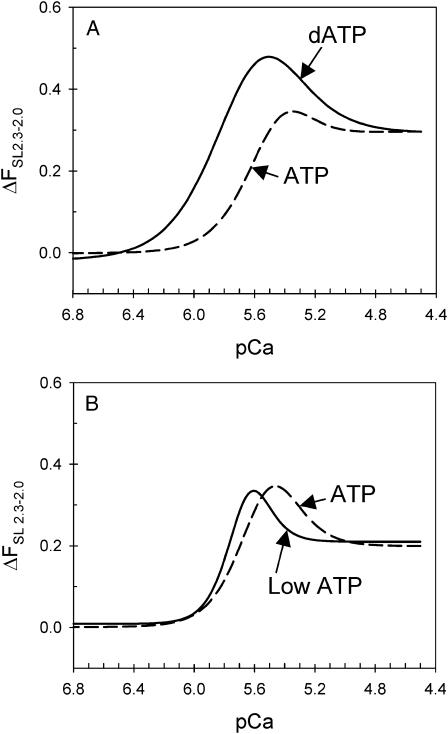
We examined the influence of cross-bridge cycling kinetics on the length dependence of steady-state force and the rate of force redevelopment (k(tr)) during Ca(2+)-activation at sarcomere lengths (SL) of 2.0 and 2.3 microm in skinned rat cardiac trabeculae. Cross-bridge kinetics were altered by either replacing ATP with 2-deoxy-ATP (dATP) or by reducing [ATP]. At each SL dATP increased maximal force (F(max)) and Ca(2+)-sensitivity of force (pCa(50)) and reduced the cooperativity (n(H)) of force-pCa relations, whereas reducing [ATP] to 0.5 mM (low ATP) increased pCa(50) and n(H) without changing F(max). The difference in pCa(50) between SL 2.0 and 2.3 microm (Delta pCa(50)) was comparable between ATP and dATP, but reduced with low ATP. Maximal k(tr) was elevated by dATP and reduced by low ATP. Ca(2+)-sensitivity of k(tr) increased with both dATP and low ATP and was unaffected by altered SL under all conditions. Significantly, at equivalent levels of submaximal force k(tr) was faster at short SL or increased lattice spacing. These data demonstrate that the SL dependence of force depends on cross-bridge kinetics and that the increase of force upon SL extension occurs without increasing the rate of transitions between nonforce and force-generating cross-bridge states, suggesting SL or lattice spacing may modulate preforce cross-bridge transitions.


Figures

FIGURE 1
FIGURE 1
Experimental protocol and example trace of trabecula activation at SL 2.0 and 2.3 μm with 5 mM ATP. SL and solution pCa are indicated above and below the trace. A single trabecula (length 1.4 mm, diameter 198 μm) at SL 2.3 μm was maximally activated (pCa 4.5) and relaxed (pCa 9.0), followed by SL adjustment (2.3 μm) and a series of step-wise activations from submaximal to maximal activations (pCa 6.0–4.5). The trabecula was then relaxed, adjusted to SL 2.0 μm and subjected to another series of step-wise activation and relaxation. Finally, to assess reproducibility, the trabecula was maximally activated (pCa 4.5) at SL 2.0 and 2.3 μm as shown. The periodic transients in the trace are due to a release-restretch protocol. The vertical calibration bar is 10 mN/mm2 and the horizontal bar is 100 s.
FIGURE 2
FIGURE 2
SL dependence of Ca2+-activation of force under differing nucleotide conditions. Force-pCa relations are compared at SL 2.3 (solid symbols) and 2.0 (open symbols) μm for 5.0 mM ATP (A, B; •, ○), 5.0 mM dATP (C, D; ▴, ▵) and 0.5 mM ATP (E, F; ▪, □). Force is scaled to either the Fmax in ATP at 2.3 μm SL (left panels) or to the respective Fmax for each condition and SL (right panels). The error bars represent mean ± SE from 8, 10, and 13 trabecula for ATP, dATP, and low ATP, respectively. The data was fit with the Hill equation and the corresponding values of pCa50 and nH are included in Table 1. The dotted curves in C and E are the Hill fit curves for the corresponding sets of control (5.0 mM ATP) experiments.
FIGURE 3
FIGURE 3
Comparison of example force traces at SL 2.3 and 2.0 μm obtained during ktr measurements from a single skinned trabecula (length 1.1 mm, diameter 140 μm) during similar levels of submaximal force activation (pCa 5.2 for SL 2.0 μm and pCa 5.4 for SL 2.3 μm) (A) and during maximal activation (pCa 4.5) (B). The SL, pCa (in brackets), and value of ktr are indicated next to each trace.
FIGURE 4
FIGURE 4
ktr-pCa relations during Ca2+-activation at SL 2.3 (solid symbols) and 2.0 (open symbols) μm in 5 mM ATP (A), 5 mM dATP (B) and 0.5 mM or low ATP (C). Symbols are as in Fig. 2. Data, with error bars representing mean ± SE, were obtained from 8, 10, and 13 trabecula with ATP, dATP, and low ATP, respectively. The solid lines represent fitted curves through the mean data points for each condition.
FIGURE 5
FIGURE 5
SL dependence of ktr-force relations for data obtained from fibers shown in Fig. 4. Symbols are as in Figs. 2 and 4. Data are shown with force expressed relative to the Fmax in ATP at SL 2.3 μm (left panels) or normalized to the Fmax for each condition and SL (right panels). The dotted curves in C and E are from the corresponding sets of control (5.0 mM ATP) experiments.
FIGURE 6
FIGURE 6
Force-pCa relations (A), ktr-pCa relations (B), and ktr-force relations (C) are illustrated for data obtained at SL 2.0 μm with (♦) and without (⋄) the osmotic compression with 4% dextran T500. Data (mean ± SE) were obtained from 5 trabecula. The solid lines are fitted curves through the mean data points.
FIGURE 7
FIGURE 7
The “magnitude” of the Frank-Starling effect (the force difference between SL 2.3 and 2.0 μm) during Ca2+-activation for ATP, dATP, and low ATP. The force difference as a function of pCa were obtained by subtracting the corresponding Hill fit curves at SL 2.0 μm from SL 2.3 μm from Fig. 2, and are compared between dATP (A) and low ATP (B) and the corresponding ATP control curves.

Similar articles

Cited by

References

    1. Adhikari, B., M. Regnier, and D. A. Martyn. 2004. At similar activation levels the rate of force redevelopment is faster at short sarcomere lengths and increased myfilament lattice spacing in skinned cardiac muscle. Biophys. J. 86:207a. - PMC - PubMed
    1. Adhikari, B. B., and K. Wang. 2004. Interplay of troponin- and myosin-based pathways of calcium activation in skeletal and cardiac muscle: the use of W7 as an inhibitor of thin filament activation. Biophys. J. 86:359–370. - PMC - PubMed
    1. Brenner, B. 1988. Effect of Ca2+ on cross-bridge turnover kinetics in skinned single rabbit psoas fibers: implications for regulation of muscle contraction. Proc. Natl. Acad. Sci. USA. 85:3265–3269. - PMC - PubMed
    1. Brenner, B., and E. Eisenberg. 1986. Rate of force generation in muscle: correlation with actomyosin ATPase activity in solution. Proc. Natl. Acad. Sci. USA. 83:3542–3546. - PMC - PubMed
    1. Brenner, B., and L. C. Yu. 1985. Equatorial x-ray diffraction from single skinned rabbit psoas fibers at various degrees of activation. Changes in intensities and lattice spacing. Biophys. J. 48:829–834. - PMC - PubMed

Publication types