. 2004 Sep;87(3):1858-72.
doi: 10.1529/biophysj.104.043794.

Incoherent manipulation of the photoactive yellow protein photocycle with dispersed pump-dump-probe spectroscopy

Affiliations

Incoherent manipulation of the photoactive yellow protein photocycle with dispersed pump-dump-probe spectroscopy

Delmar S Larsen et al. Biophys J. 2004 Sep.

Abstract

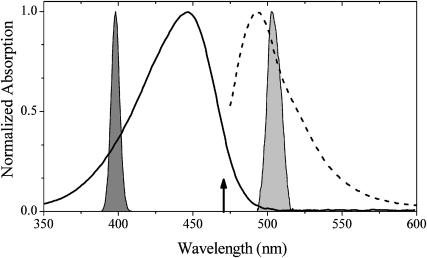
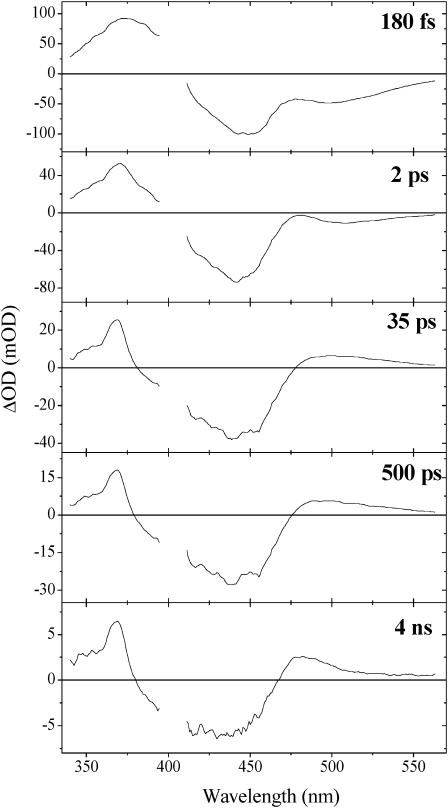
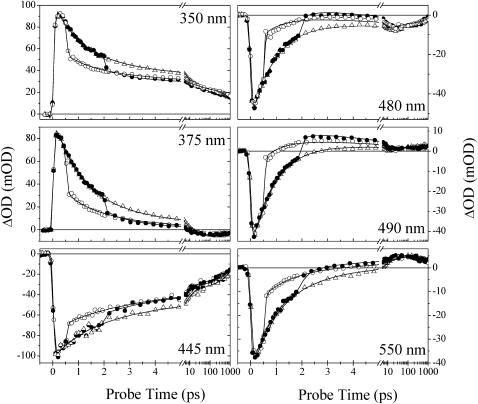
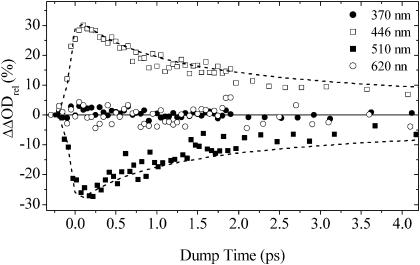
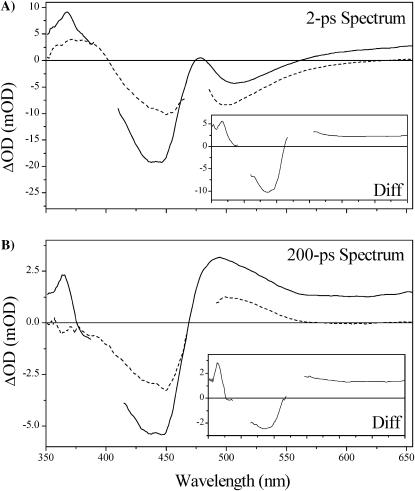
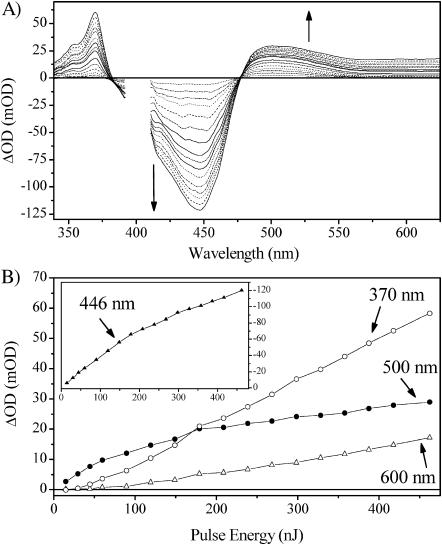
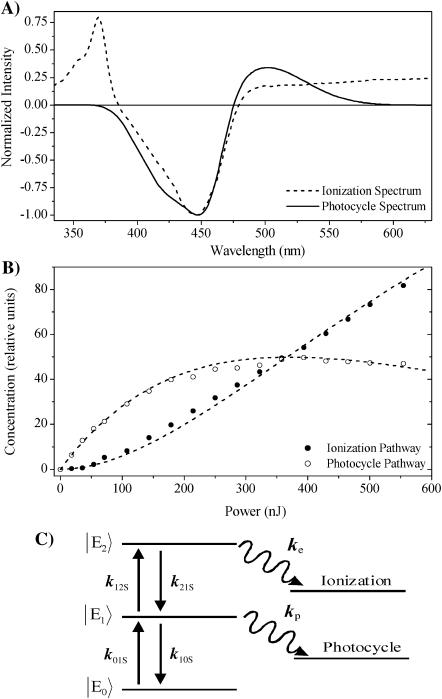
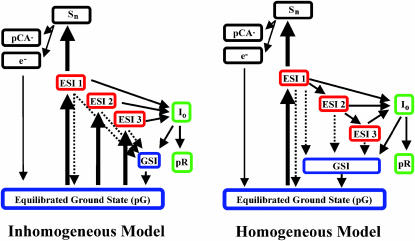
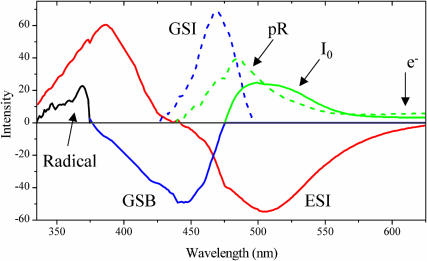
Photoactive yellow protein is the protein responsible for initiating the "blue-light vision" of Halorhodospira halophila. The dynamical processes responsible for triggering the photoactive yellow protein photocycle have been disentangled with the use of a novel application of dispersed ultrafast pump-dump-probe spectroscopy, where the photocycle can be started and interrupted with appropriately tuned and timed laser pulses. This "incoherent" manipulation of the photocycle allows for the detailed spectroscopic investigation of the underlying photocycle dynamics and the construction of a fully self-consistent dynamical model. This model requires three kinetically distinct excited-state intermediates, two (ground-state) photocycle intermediates, I(0) and pR, and a ground-state intermediate through which the protein, after unsuccessful attempts at initiating the photocycle, returns to the equilibrium ground state. Also observed is a previously unknown two-photon ionization channel that generates a radical and an ejected electron into the protein environment. This second excitation pathway evolves simultaneously with the pathway containing the one-photon photocycle intermediates.


Figures

FIGURE 1
FIGURE 1
Normalized static absorption (solid line) and fluorescence (dashed line) spectra of PYP overlapping the spectra of the 395-nm pump (shaded) and the 505-nm dump (light shaded) laser pulses. The arrow at 470 nm indicates the wavelength used for red-edge excitation of the sample in the excitation-wavelength-dependent experiment.
FIGURE 2
FIGURE 2
Representative dispersion-corrected transient PP spectra. The region around the pump excitation wavelength (395 nm) is corrupted due to scatter from the pump pulse.
FIGURE 3
FIGURE 3
Selected PP (open triangles) and PDP traces dumped at 500 fs (open circles) and 2 ps (solid circles). Symbols are the experimental data and the solid lines are the results of the global fits to these data. Note that the time axis is linear up to 5 ps, and then logarithmic to 1 ns.
FIGURE 4
FIGURE 4
Action trace of PYP, measured with probe time at 500 ps. Plotted is the ΔΔODrel signal (PDP-PP)/PP versus the dump time. The open squares are the dump-induced depletion of the bleach (446 nm) and the solid squares are the induced-depletion of the I0 photoproduct absorption (510 nm). The solid and open circles are the depletion of the radical (370 nm) and the ejected electron (620 nm), respectively. The amplitude of the PP signals were 13 mOD (radical), 30 mOD (bleach), 12 mOD (I0), and 4 mOD (electron). Overlapping the bleach and I0 signals is the modeled excited-state population with the parameters from Table 1 (dashed line).
FIGURE 5
FIGURE 5
Excitation-wavelength dependence on the 2-ps (A) and 200-ps (B) PP spectra. The solid and dashed curves are the PP spectra generated after either 395-nm or 470-nm excitation, respectively.
FIGURE 6
FIGURE 6
Power dependence of the PP data with 395-nm excitation. (A) Power dependence of the 200-ps PP spectrum. The region around the pump excitation wavelength is corrupted due to scatter from the pump pulse. The arrows indicates the direction of the signal change with increasing laser power. (B) Power dependence of representative wavelengths (as labeled). (Inset) (Negative) dependence of the bleach because of its greater range.
FIGURE 7
FIGURE 7
Analysis of the power-dependent PP spectra at 200 ps. (A) Estimated spectra associated with the photocycle (solid curve) and ionization (dashed curve) pathways. (B) Power-dependent concentration of the two pathways overlapping the predicted curves for the proposed model in the inset. (C) Abridged multistate photocycle model to explain observed power dependence. Fitting parameters: {k01S, k10S}= 44,000 cm2/mmol and {k12S, k21S}= 45,000 cm2/mmol. The used ke = 1/100 fs and kp = 1/2 ps time constants are relatively insensitive in modeling a single PP spectrum and are mean values from the full analysis shown in Table 1.
FIGURE 8
FIGURE 8
Connectivity schemes compatible with the data and used in the global analysis: (A) inhomogeneous model and (B) homogeneous model. Dynamical states are separated into four classes: excited state (red), ground state (blue), photocycle products (green), and two-photon ionization dynamics (black). ESI1, ESI2, and ESI3 refer to the excited-state lifetimes #1, #2, and #3, respectively. pG is the equilibrated ground-state species, and GSI is the ground-state intermediate. Thick solid arrows represent the initial excitation process from the laser pulse and thin solid arrows dynamics represent the “natural” PP population dynamics. The dashed arrows represent the population transfer dynamics that may be enhanced with the dump pulse.
FIGURE 9
FIGURE 9
Species-associated spectra (SAS) estimated from the global analysis of the PP and PDP traces. The red curve is the SAS associated with the ESI1, ESI2, and ESI3 states. The dashed blue curve is the ground-state intermediate, and the solid green and dashed green curves are the I0 and pR photoproducts, respectively. The solid blue curve is the bleach common to all transient ground states. The black curve is the pCA radical spectrum. These estimated spectra were also supported with the global fit of polarization-dependent PP data, which is published elsewhere (van Stokkum et al., 2004).

References

    1. Baca, M., G. E. Borgstahl, M. Boissinot, P. M. Burke, D. R. Williams, K. A. Slater, and E. D. Getzoff. 1994. Complete chemical structure of photoactive yellow protein: novel thioester-linked 4-hydroxycinnamyl chromophore and photocycle chemistry. Biochemistry. 33:14369–14377. - PubMed
    1. Baltuška, A., I. H. M. van Stokkum, A. Kroon, R. Monshouwer, K. J. Hellingwerf, and R. van Grondelle. 1997. The primary events in the photoactivation of yellow protein. Chem. Phys. Lett. 270:263–266.
    1. Brudler, R., R. Rammelsberg, T. T. Woo, E. D. Getzoff, and K. Gerwert. 2001. Structure of the I1 early intermediate of photoactive yellow protein by FTIR spectroscopy. Nat. Struct. Biol. 8:265–270. - PubMed
    1. Changenet, P., H. Zhang, M. J. van der Meer, K. J. Hellingwerf, and M. Glasbeek. 1998. Subpicosecond fluorescence upconversion measurements of primary events in yellow proteins. Chem. Phys. Lett. 282:276–282.
    1. Changenet-Barret, P., C. Choma, E. Gooding, W. DeGrado, and R. M. Hochstrasser. 2000. Ultrafast dielectric response of proteins from dynamics stokes shifting of coumarin in calmodulin. J. Phys. Chem. B. 104:9322–9329.

Publication types

MeSH terms