

Micro-volume couette flow sample orientation for absorbance and fluorescence linear dichroism
- PMID: 15345576
- PMCID: PMC1304603
- DOI: 10.1529/biophysj.103.035022
Micro-volume couette flow sample orientation for absorbance and fluorescence linear dichroism
Abstract
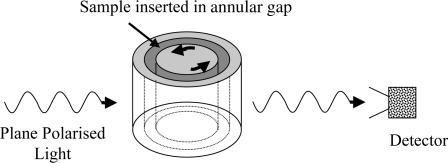
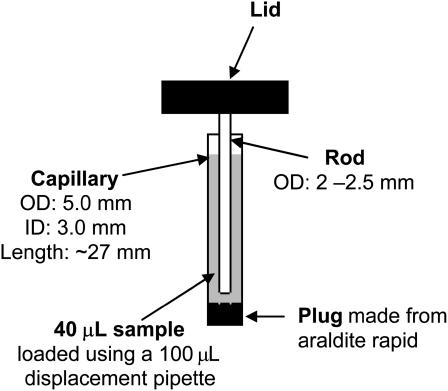
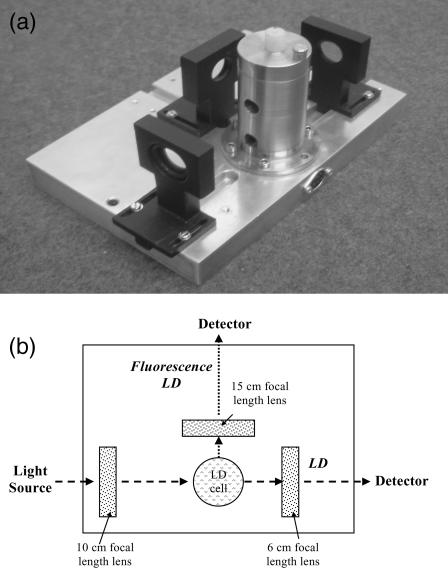
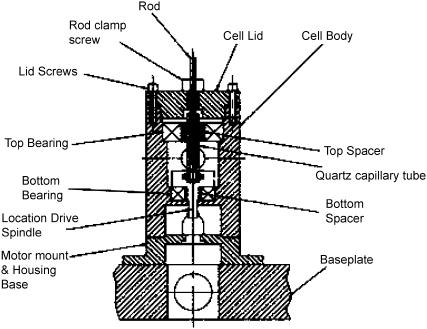
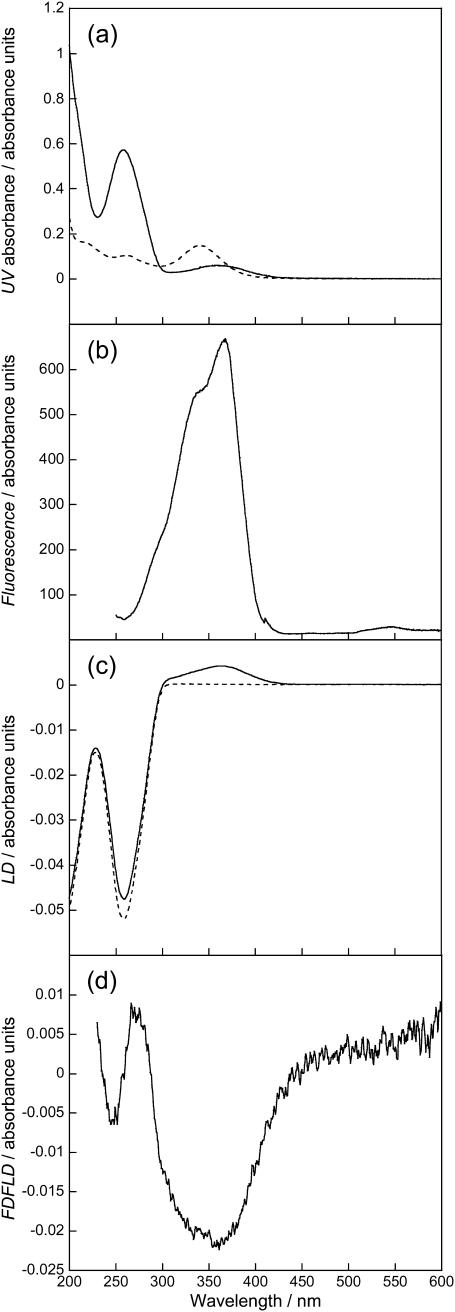
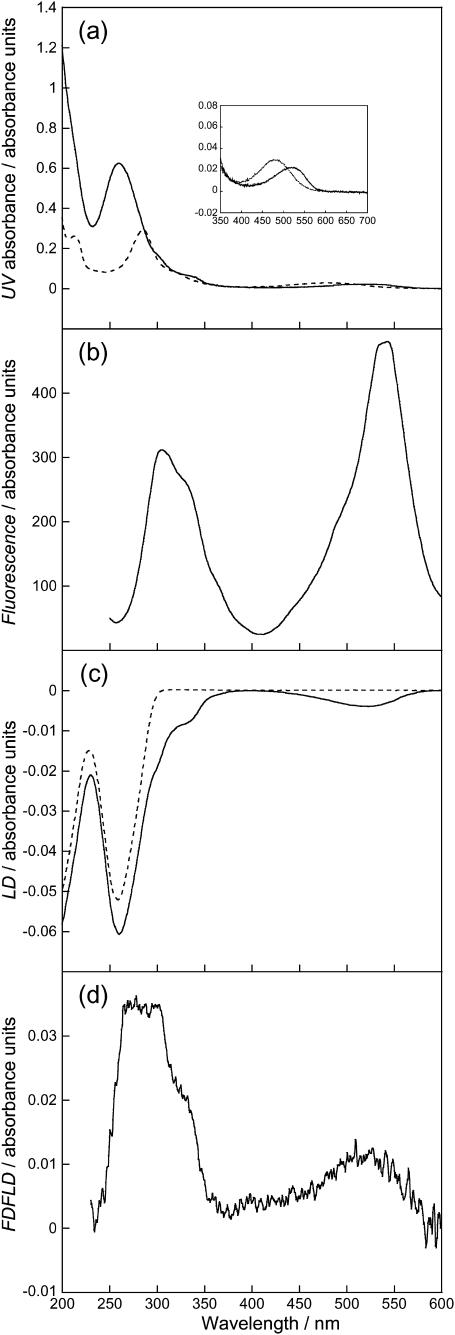
Linear dichroism (LD) can be used to study the alignment of absorbing chromophores within long molecules. In particular, Couette flow LD has been used to good effect in probing ligand binding to DNA and to fibrous proteins. This technique has been previously limited by large sample requirements. Here we report the design and application of a new micro-volume Couette flow cell that significantly enhances the potential applications of flow LD spectroscopy by reducing the sample requirements for flow linear dichroism to 25 microL (with concentrations such that the absorbance maximum of the sample in a 1-cm pathlength cuvette is approximately 1). The micro-volume Couette cell has also enabled the measurement of fluorescence-detected Couette flow linear dichroism. This new technique enables the orientation of fluorescent ligands to be probed even when their electronic transitions overlap with those of the macromolecule and conversely. The potential of flow-oriented fluorescence dichroism and application of the micro-volume Couette LD cell are illustrated by the collection of data for DNA with minor groove and intercalating ligands: DAPI, Hoechst, and ethidium bromide. As with conventional fluorescence, improved sensitivity compared with absorbance LD is to be expected after instrumentation optimization.
Figures
References
-
- Bloemendal, M., and R. Vangrondelle. 1993. Linear-dichroism spectroscopy for the study of structural properties of proteins. Mol. Biol. Rep. 18:49–69. - PubMed
-
- Chou, P., and W. C. Johnson. 1993. Base inclinations in natural and synthetic dyes. J. Am. Chem. Soc. 115:1205–1214.
-
- Colson, P., C. Houssier, and C. Bailly. 1995. Use of electric linear dichroism and competition experiments with intercalating drugs to investigate the mode of binding of Hoechst-33258, Berenil and Dapi to Gc sequences. J. Biomol. Struct. Dyn. 13:351–366. - PubMed
-
- Couette, M. 1890. Etudes sur le frottement des liquides. Ann. Chim. Phys. 6:433–510.
Publication types
MeSH terms
Substances
LinkOut - more resources
Full Text Sources
Other Literature Sources
Research Materials
