The mobility of phytochrome within protonemal tip cells of the moss Ceratodon purpureus, monitored by fluorescence correlation spectroscopy
- PMID: 15345577
- PMCID: PMC1304604
- DOI: 10.1529/biophysj.103.038521
The mobility of phytochrome within protonemal tip cells of the moss Ceratodon purpureus, monitored by fluorescence correlation spectroscopy
Abstract
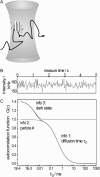
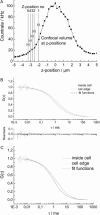
Fluorescence correlation spectroscopy (FCS) is a versatile tool for investigating the mobilities of fluorescent molecules in cells. In this article, we show that it is possible to distinguish between freely diffusing and membrane-bound forms of biomolecules involved in signal transduction in living cells. Fluorescence correlation spectroscopy was used to measure the mobility of phytochrome, which plays a role in phototropism and polarotropism in protonemal tip cells of the moss Ceratodon purpureus. The phytochrome was loaded with phycoerythrobilin, which is fluorescent only in the phytochrome-bound state. Confocal laser scanning microscopy was used for imaging and selecting the xy measuring position in the apical zone of the tip cell. Fluorescence correlation was measured at ancient z-positions in the cell. Analysis of the diffusion coefficients by nonlinear least-square fits showed a subcellular fraction of phytochrome at the cell periphery with a sixfold higher diffusion coefficient than in the core fraction. This phytochrome is apparently bound to the membrane and probably controls the phototropic and polarotropic response.
Figures


Similar articles
-
Microinjection of heme oxygenase genes rescues phytochrome-chromophore-deficient mutants of the moss Ceratodon purpureus.Planta. 2000 Mar;210(4):529-35. doi: 10.1007/s004250050041. Planta. 2000. PMID: 10787045
-
Recombinant phytochrome of the moss Ceratodon purpureus (CP2): fluorescence spectroscopy and photochemistry.J Photochem Photobiol B. 2000 Jul;56(2-3):145-53. doi: 10.1016/s1011-1344(00)00067-1. J Photochem Photobiol B. 2000. PMID: 11079475
-
Phytochrome control of phototropism and chlorophyll accumulation in the apical cells of protonemal filaments of wildtype and an aphototropic mutant of the moss Ceratodon purpureus.Plant Cell Physiol. 1997 Jan;38(1):51-8. doi: 10.1093/oxfordjournals.pcp.a029084. Plant Cell Physiol. 1997. PMID: 11536802
-
Biosynthesis of phycobilins. Formation of the chromophore of phytochrome, phycocyanin and phycoerythrin.J Photochem Photobiol B. 1990 Apr 1;5(1):3-23. doi: 10.1016/1011-1344(90)85002-e. J Photochem Photobiol B. 1990. PMID: 2111391 Review.
-
Fluorescence correlation spectroscopy for the detection and study of single molecules in biology.Bioessays. 2002 Aug;24(8):758-64. doi: 10.1002/bies.10118. Bioessays. 2002. PMID: 12210537 Review.
Cited by
-
Fluorescence of phytochrome adducts with synthetic locked chromophores.J Biol Chem. 2011 Jan 14;286(2):1103-13. doi: 10.1074/jbc.M110.155143. Epub 2010 Nov 11. J Biol Chem. 2011. PMID: 21071442 Free PMC article.
-
Single-molecule dynamics of phytochrome-bound fluorophores probed by fluorescence correlation spectroscopy.Proc Natl Acad Sci U S A. 2006 Jul 25;103(30):11136-41. doi: 10.1073/pnas.0604724103. Epub 2006 Jul 14. Proc Natl Acad Sci U S A. 2006. PMID: 16844775 Free PMC article.
-
An evolutionarily conserved signaling mechanism mediates far-red light responses in land plants.Plant Cell. 2013 Jan;25(1):102-14. doi: 10.1105/tpc.112.104331. Epub 2013 Jan 9. Plant Cell. 2013. PMID: 23303916 Free PMC article.
-
Novel application of fluorescence lifetime and fluorescence microscopy enables quantitative access to subcellular dynamics in plant cells.PLoS One. 2009 May 27;4(5):e5716. doi: 10.1371/journal.pone.0005716. PLoS One. 2009. PMID: 19492078 Free PMC article.
-
A phytochrome-phototropin light signaling complex at the plasma membrane.Proc Natl Acad Sci U S A. 2012 Jul 24;109(30):12231-6. doi: 10.1073/pnas.1120203109. Epub 2012 Jul 5. Proc Natl Acad Sci U S A. 2012. PMID: 22773817 Free PMC article.
References
-
- Aragon, S. R., and R. Pecora. 1976. Fluorescence correlation spectroscopy as a probe of molecular-dynamics. J. Chem. Phys. 64:1791–1803.
-
- Brücker, G., M. Zeidler, T. Kohchi, E. Hartmann, and T. Lamparter. 2000. Microinjection of heme oxygenase genes rescues phytochrome-chromophore-deficient mutants of the moss Ceratodon purpureus. Planta. 210:529–535. - PubMed
Publication types
MeSH terms
Substances
LinkOut - more resources
Full Text Sources
Other Literature Sources

