. 2004 Sep;87(3):2022-34.
doi: 10.1529/biophysj.103.035097.

Coordinated behavior of mitochondria in both space and time: a reactive oxygen species-activated wave of mitochondrial depolarization

Affiliations

Coordinated behavior of mitochondria in both space and time: a reactive oxygen species-activated wave of mitochondrial depolarization

Nathan R Brady et al. Biophys J. 2004 Sep.

Abstract

Reactive oxygen species (ROS) can trigger a transient burst of mitochondrial ROS production via ROS activation of the mitochondrial permeability transition pore (MPTP), a phenomenon termed ROS-induced ROS release (RIRR). The goal of this study was to investigate if the generation of ROS in a discrete region of a cardiomyocyte could serve to propagate RIRR-mediated mitochondrial depolarizations throughout a cell. Our experiments revealed that localized RIRR activated either RIRR-mediated fluctuations in mitochondrial membrane potential (time period: 3-10 min) or a traveling wave of depolarization of the cell's mitochondria (velocity: approximately 5 microm/min). Both phenomena appeared to be mediated by the mitochondrial permeability transition pore and eventually encompassed the majority of the mitochondrial population of both isolated rat and rabbit cardiomyocytes. Furthermore, depolarization was often reversible; the waves of depolarization were then followed by a rapid (approximately 40 microm/min) repolarization wave of the mitochondria. We show that the RIRR can function to communicate the mitochondrial permeability transition from one mitochondrion to another in the isolated adult cardiomyocyte.


Figures

FIGURE 1
FIGURE 1
Organization of the mitochondria of an isolated cardiomyocyte. A rat cardiomyocyte was loaded with 0.2 μM TMRM, and a 0.7-μm optical section of the cell was imaged at a high spatial resolution (3× Kalman averaging). This figure is representative of images used to calculated characteristics of mitochondria arranged longitudinally along the myofibrils (Table 1). L.R. is an example of a measured longitudinal row, N is a nucleus, and G refers to the longitudinal gaps between mitochondria. Scale bar = 5 μm.
FIGURE 2
FIGURE 2
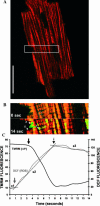
Localized photoexcitation of TMRM: dynamics of ΔΨ- and ROS production at the level of a single mitochondrion. The 0.2-μM TMRM and 10.0-μM DCF fluorescence were measured in mitochondria of a typical rat cardiomyocyte (as shown labeled with TMRM in A). (B) From t = 0 onwards, confocal imaging of DCF and TMRM fluorescence was confined to the region bounded by the white box and repeated each second, simultaneously recording the decrease in TMRM fluorescence (which reports changes in ΔΨ) and increase in DCF fluorescence (which reports on the presence of ROS). (C) The kinetics of depolarization and ROS production in a single mitochondrion (○ in B). The arrows (shaded for DCF and solid for TMRM) indicate the time points where a significant change occurred. Three lines (s1, s2, and s3) refer to the slopes (rates) of changes in DCF fluorescence. Arrow 1 (shaded) indicates the shift to a faster increase in DCF fluorescence (intersection of s1 and s2), arrow 2 (solid) indicates the point at which ΔΨ began to decrease, arrow 3 refers the point at which DCF fluorescence increase slowed and ΔΨ had collapsed (intersection of s2 and s3). See online Supplementary Material for an example movie. This is one experiment that is representative of more than three.
FIGURE 3
FIGURE 3
ROS-induced changes in mitochondrial membrane potential. Rabbit cardiomyocytes were dual loaded with 0.3 μM MTG and 0.7 μM TMRM. The FRET interaction between the MTG, covalently bound in the mitochondrial matrix, and the electrophoretically accumulating TMRM was used to image the energetic state of the mitochondria, via excitation of MTG at 488 nm and simultaneous recording of red and green fluorescence. Red fluorescence indicated a FRET interaction between MTG and TMRM, i.e., polarized mitochondria. The gain (unquenching) of green fluorescence indicated loss of TMRM from the mitochondria, i.e., mitochondrial depolarization. The requenching of green fluorescence was indicative of mitochondrial repolarization. ROS production was restricted to the area bounded by the white box (i) by intense laser scanning of TMRM at 568 nm, until TMRM fluorescence in the region began to decrease. As demonstrated by increased green fluorescence, intense photoexcitation activated mitochondrial depolarizations outside the area of primary ROS production (i). Nearly the entire mitochondrial population exhibited variations in ΔΨ for ∼5 min (iiv), before returning to a polarized state (vi). Images were obtained with a Zeiss 510 LSCM. This is one experiment that is representative of three. Scale bar = 20 μm.
FIGURE 4
FIGURE 4
The cellular effect of a localized production of ROS: fluctuations and waves of mitochondrial depolarizations, concomitant with the activation of the MPTP. (A) Cardiomyocytes were incubated with 1.0 μM calcein-AM for (left) 15 min at 37°C or (right) 30 min at room temperature (RT). Calcein-containing medium was then removed and replaced with fresh medium containing 10 μM Syto 83, and cells were imaged 30 min later. In the warm-loaded cells, calcein fluorescence was observed in the nuclei (N), colocalizing with the red fluorescing nuclear stain Syto 83. However, calcein fluorescence was not observed in the perinuclear region (P) or in voids that run longitudinal rows (LR). In the RT-loaded cells, green fluorescing calcein was observed homogeneously throughout the cell. Images were obtained with a Bio-Rad Radiance 2000 LSCM. Scale bar = 20 μm. (B, left panel) Cardiomyocytes were dual loaded 15 min at 37°C with 0.20 μM TMRM and 1.0 μM calcein-AM, thereby resulting in the cytosolic distribution of calcein initially to be in excess over that in mitochondria. Before localized ROS production, calcein was more concentrated in the cytosol, and the mitochondria appear as voids in green, and red regions identify polarized mitochondria, as demonstrated by merging the TMRM and calcein images. (B, right panels) After the ROS production via line scanning, we observed localized loss of both TMRM (depolarization) and calcein fluorescence (photobleaching). Subsequently, the mitochondria depolarized as a function of distance from the region line scanned and green fluorescence appeared in regions previously labeled by TMRM (i.e., the mitochondria) demonstrating the participation of the MPTP (iivi). The wave of depolarization proceeded at ∼5 μm/min. Images were obtained with a Leica TCS-4D LSCM. This is one experiment that is representative of more than three. Scale bars = 20 μm. (C). Treatment with cyclosporin A (CsA) blocked the spread of mitochondria depolarization. The cell was line scanned (i, boxed region), locally resulting in decreased TMRM and increased DCF fluorescence. Imaging for several minutes showed that no change in TMRM or DCF fluorescence occurred outside this region in CsA-treated cells (iii). This is one experiment that is representative of more than three.
FIGURE 5
FIGURE 5
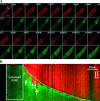
Depolarization coincided with increased production of ROS. (A) Rat cardiomyocytes were dual loaded with 10.0 μM DCFH2-DA and 0.1 μM TMRM, and imaged every 30 s after a localized production of ROS (box in i). Basal ROS presence was low, as detected by the cell-permeant, green-fluorescent dye, DCFH2-DA, which becomes fluorescent when oxidized to DCF (Swift and Sarvazyan, 2000) (green). ROS production sufficient to activate the MPTP was localized to the region bordered by the white box (i). Subsequently, a wave of mitochondrial depolarization occurred (iix) at an average velocity of ∼5 μm/min. The mitochondrial depolarizations coincided with increased DCFH2 oxidation; i.e., increased ROS production. See online Supplementary Material for full-length movie. (B) To observe the kinetics of wave progression through the cardiomyocyte changes in TMRM (red) and DCF (green) fluorescence were measured along a longitudinal row of mitochondria (line in A, i) through all time points imaged. Time is represented on the y axis, and the x axis corresponds to the row of mitochondria. The originally targeted region is represented by the box localized RIRR, and the wave progresses from left to right. Wave velocity is denoted by the dotted white line. Closed arrows indicate examples of mitochondria that remained polarized after passage of the wave front, and open arrows indicate examples of mitochondria depolarizing before passage of the wave front. Images were obtained with a Bio-Rad Radiance 2000 LSCM. This is one experiment that is representative of more than three. Scale bar = 20 μm.
FIGURE 6
FIGURE 6
Depolarization coincided with increased lipid peroxidation. Rabbit cardiomyocytes were dual loaded with 0.5 μM BODIPY C11(581/591) and 0.2 μM TMRM. The presence of ROS was detected with the lipophilic, red fluorescent dye, BODIPY C11(581/591). This probe embeds into membranes and upon oxidation undergoes red-to-green shift and can therefore be used as a marker for lipid peroxidation (Pap et al., 1999). The cell was scanned (543 nm) in the region bordered by the white box (i) until mitochondria locally depolarized. After localized production of ROS due to photoexcitation of TMRM, a wave of depolarization proceeded at a velocity of ∼5 μm/min (iivi). The mitochondrial depolarizations (indicated by loss of red fluorescence) coincided with increased green BODIPY C11(581/591) fluorescence; i.e., increased lipid peroxidation (iivi). After the wave of depolarization, the mitochondrial population repolarized at a velocity of ∼40 μm/min (viiviii). Images were obtained with a Zeiss 510 LSCM. This is one experiment that is representative of three. Scale bar = 20 μm.
FIGURE 7
FIGURE 7
Rotenone blocked the wave of depolarization. Rat cardiomyocytes were dual loaded with 10.0 μM DCFH2-DA and 0.1 μM TMRM. Before imaging, cells were incubated for 30 min with 1 μM rotenone. Intense laser photoexcitation resulted in local depolarizations (B). (C) Subsequently, these depolarizations did not spread during the time period imaged (>5 min). Images were obtained with a Bio-Rad Radiance 2000 LSCM. This is one experiment that is representative of three. Scale bar = 20 μm.
FIGURE 8
FIGURE 8
Scheme of RIRR and RIRR transmission. At the level of the mitochondrion, RIRR occurred over a period of ∼7 s. (1) MPTP activation occurs in response to a local increase in ROS. (2) MPTP activation results in ΔΨ-collapse and enhanced ETC ROS generation. (3) ROS exits the mitochondrion via AC, located in either the IMM or OMM. A delay of 11 s occurs before activation of RIRR in the neighboring mitochondrion, perhaps evidencing compartmentalized ROS scavenging or a protein mediated RIRR signal relay. Locally RIRR was blocked by CsA, BA, and rotenone (Zorov et al., 2000). Wave transmission was blocked by CsA (Fig. 4 D), DIDS (our unpublished data), and ROT (Fig. 7). MPTP, mitochondrial permeability transition pore; ETC, electron transport chain; ΔΨ, mitochondrial membrane potential; OMM, outer mitochondrial membrane; IMM, inner mitochondrial membrane; IMS, intermembrane space; AC, anion channels; CsA, cyclosporin A; BA, bongkrekic acid; ROT, rotenone.

References

    1. Amchenkova, A. A., L. E. Bakeeva, Y. S. Chentsov, V. P. Skulachev, and D. B. Zorov. 1988. Coupling membranes as energy-transmitting cables. I. Filamentous mitochondria in fibroblasts and mitochondrial clusters in cardiomyocytes. J. Cell Biol. 107:481–495. - PMC - PubMed
    1. Aon, M. A., S. Cortassa, E. Maraban, and B. O'Rourke. 2003. Synchronized whole-cell oscixllations in mitochondrial metabolism triggered by a local release of reactive oxygen species in cardiac myocytes. J. Biol. Chem. 278:44735–44744. - PubMed
    1. Armstrong, J. S., and D. P. Jones. 2002. Glutathione depletion enforces the mitochondrial permeability transition and causes cell death in Bcl-2 overexpressing HL60 cells. FASEB J. 16:1263–1265. - PubMed
    1. Aronis, A., R. Komarnitsky, S. Shilo, and O. Tirosh. 2002. Membrane depolarization of isolated rat liver mitochondria attenuates permeability transition pore opening and oxidant production. Antioxid. Redox. Signal. 4:647–654. - PubMed
    1. Beavis, A. D., and H. Davatol-Hag. 1996. The mitochondrial inner membrane anion channel is inhibited by DIDS. J. Bioenerg. Biomembr. 28:207–214. - PubMed

Publication types

LinkOut - more resources