. 2004 Sep;87(3):2060-73.
doi: 10.1529/biophysj.104.041749.

A mitochondrial oscillator dependent on reactive oxygen species

Affiliations

A mitochondrial oscillator dependent on reactive oxygen species

Sonia Cortassa et al. Biophys J. 2004 Sep.

Abstract

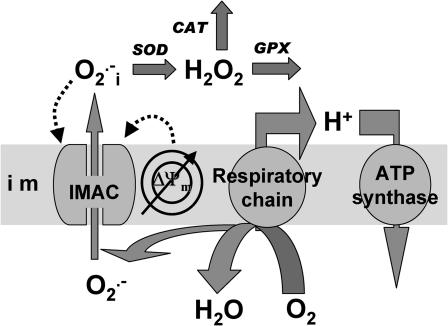
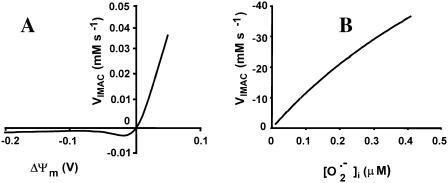
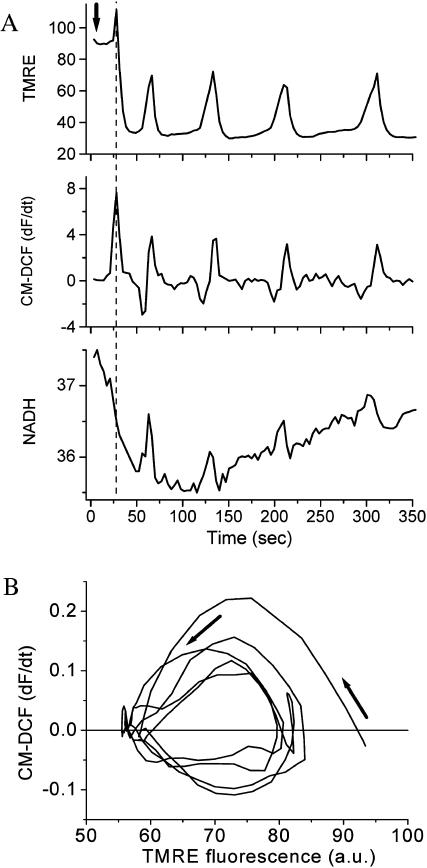
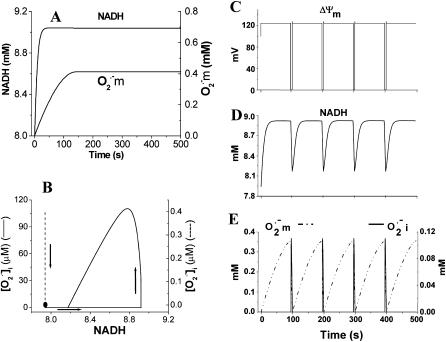
We describe a unique mitochondrial oscillator that depends on oxidative phosphorylation, reactive oxygen species (ROS), and mitochondrial inner membrane ion channels. Cell-wide synchronized oscillations in mitochondrial membrane potential (Delta Psi(m)), NADH, and ROS production have been recently described in isolated cardiomyocytes, and we have hypothesized that the balance between superoxide anion efflux through inner membrane anion channels and the intracellular ROS scavenging capacity play a key role in the oscillatory mechanism. Here, we formally test the hypothesis using a computational model of mitochondrial energetics and Ca(2+) handling including mitochondrial ROS production, cytoplasmic ROS scavenging, and ROS activation of inner membrane anion flux. The mathematical model reproduces the period and phase of the observed oscillations in Delta Psi(m), NADH, and ROS. Moreover, we experimentally verify model predictions that the period of the oscillator can be modulated by altering the concentration of ROS scavengers or the rate of oxidative phosphorylation, and that the redox state of the glutathione pool oscillates. In addition to its role in cellular dysfunction during metabolic stress, the period of the oscillator can be shown to span a wide range, from milliseconds to hours, suggesting that it may also be a mechanism for physiological timekeeping and/or redox signaling.


Figures

FIGURE 1
FIGURE 1
Model of mitochondrial energetics coupled to ROS production, transport, and scavenging. Equations describing the IMAC and the ROS scavenging system (see Appendix, Eqs. A8–A11) were incorporated into an integrated model of mitochondrial energetics and Ca2+ handling (Cortassa et al., 2003). ROS production was modeled as a shunt of electrons from the electron transport chain into the matrix (see Methods and Appendix). The model postulates that superoxide anion (formula image) is transported through the IMAC whose opening probability is activated by cytoplasmic (intermembrane) superoxide anion (formula image). Key to abbreviations: im, inner mitochondrial membrane; IMAC, inner membrane anion channel; CAT, catalase; SOD, Cu,Zn superoxide dismutase; GPX, glutathione peroxidase.
FIGURE 2
FIGURE 2
Modeling of IMAC. (A) The current-voltage relationship for IMAC was formulated as previously reported (Borecky et al., 1997). The rate of anion flux through IMAC (VIMAC; in mM s−1) is described by Eq. A12. The transport of formula image across the inner mitochondrial membrane is proportionally coupled to the IMAC rate, driven by the Nernst potential for formula image (see Eq. A13). The formula image concentration in the plot in A is 0.1 nM. In B, the membrane potential was fixed at −180 mV. The parameters used in the plots are Gl = 0.0782 mM s−1 V−1; Gmax = 7.82 mM s−1 V−1; κ = 70 V−1; formula image; Kcc = 1.0 × 10⁻² mM (A) or 1.0 × 10⁻³ mM (B); a = 1.0 × 10⁻³; and b = 1.0 × 10⁴.
FIGURE 3
FIGURE 3
Experimental characterization of mitochondrial oscillations. (A) Simultaneous, whole-cell recordings of the temporal evolution of fluorescence intensity for TMRE, CM-DCF (dF/dt), and the endogenous NADH signals (fluorescence expressed in arbitrary units; a.u.). Oscillations in mitochondrial metabolism were triggered in cardiomyocytes loaded with TMRE (ΔΨm indicator) and CM-H2DCFDA (ROS-sensitive) (37°C) after a local laser flash (arrow), as previously described (Aon et al., 2003). Briefly, an 8.7 × 8.7-μm region of the cell was excited in a single flash resulting in rapid loss of ΔΨm and local generation of ROS. (B) Representative phase-plane plot of the rate of ROS production (first derivative of the CM-DCF signal) versus ΔΨm (TMRE) showing the convergence of the dynamic behavior toward a limit cycle (arrows) after an initial wide excursion of the trajectory corresponding to the first mitochondrial ΔΨm depolarization (see Fig. 3 A, top panel). The negative values of the ROS signal derivative are due to fluorescence resonance energy transfer between TMRE and CM-DCF as previously described (Aon et al., 2003).
FIGURE 4
FIGURE 4
Simulation of sustained mitochondrial oscillations. Simulation of the integrated model of mitochondrial energetics with incorporated IMAC, ROS production, and ROS scavenging. Shown in A and CE are the evolution of NADH and mitochondrial formula image toward steady (i.e., a fixed-point attractor) or oscillatory (i.e., limit-cycle) states, respectively. B shows the phase-plane plot of NADH and formula image for the steady (dashed) and oscillatory (continuous) solutions. The change from a fixed-point attractor to limit-cycle behavior was achieved simply by increasing the concentration of respiratory chain carriers, ρres (see the model of Cortassa et al., 2003) from 2.0 × 10⁻⁶ mM to 2.5 × 10⁻⁶ mM, while keeping all other parameters constant (shunt = 0.0533; formula image = 0.013 μM). The other parameters used in the simulations are described in the legend of Fig. 5.
FIGURE 5
FIGURE 5
Bifurcation diagrams of ΔΨm (A) and NADH (B) state variables as a function of ROS production and scavenging. The behavior of the whole model was studied with the AUTO 97 software, as a function of the fraction of respiratory flux diverted to formula image production (shunt, see Eq. A8 in the Appendix) and the rate of ROS scavenging, varied through the concentration of Cu,Zn SOD (formula image). The bifurcation diagrams showed an upper branch, in which ΔΨm was predominantly polarized, and a lower branch, in which ΔΨm was mainly depolarized. Thick lines indicate domains of stable steady-state behavior whereas thin lines denote either unstable or oscillatory states. A stable oscillatory domain, embedded within the upper branch, emerged as SOD concentration increased. The eigenvalues obtained from the stability analysis were further analyzed to obtain a detailed description of the transitions at the borders of the steady states. As a representative example, these points are labeled with numbered arrowheads in one of the bifurcation diagrams in A, corresponding to the following state transitions: 1 and 2 of the upper branch indicate Hopf bifurcations delimiting the oscillatory region (thin line), characterized by two pairs of complex conjugates with one pair showing positive real parts. In the stable regions of the diagram (thick lines), all real negative eigenvalues were found, and one or two pairs of complex conjugates, but with negative real parts; 3 and 4 denote limit points. At 3 the system “jumps” to the lower branch and stays there at a ROS production rate shunt value ≥0.231556, whereas at 4 the system dynamics can “jump” back to the upper branch and when the shunt ≤0.179225. Points 3 and 4 delimit an unstable region characterized by at least one or two real-positive eigenvalues and the rest real-negative. From left to right, the SOD concentration was (in μM): 0.5, 0.6, 0.79, 1.18, and 1.28. The simulations were performed with the following set of parameters (see Cortassa et al., 2003, for detailed parameter descriptions): concentration of respiratory chain carriers, ρres = 2.5 × 10⁻⁶ mM; concentration of F1F0 ATPase, ρF1 = 2.03 × 10⁻³ mM; [Ca2+]i = 0.1 μM; Kcc = 0.01 mM; formula image = 2.4 × 10⁶ mM−1 s−1; formula image = 1.7 × 10⁴ mM−1 s−1; GT = 0.5 mM; maximal rate of the adenine nucleotide translocase, VmaxANT = 5 mM s−1; and maximal rate of the mitochondrial Na-Ca exchanger, formula image Remaining parameters were set as described in Table A1 and Cortassa et al. (2003).
FIGURE 6
FIGURE 6
Sequence of events occurring during an oscillatory cycle. The time course of changes in ΔΨm, IMAC flux, SOD activity, and cytosolic formula image during a single cycle of the mitochondrial oscillator. At a critical level of mitochondrial ROS accumulation (see Fig. 4 E) the IMAC channel rapidly opens, denoted by the spike in outward current, provoking the sudden release of formula image from the mitochondria into the intermembrane space. The current through IMAC quickly declines due to the loss of ΔΨm (which decreases the driving force for anions; see Eq. A13). The rate of SOD increases in parallel with the burst of available formula image and stays high until the formula image is consumed, at which point IMAC closes, allowing ΔΨm to repolarize, initiating the next cycle.
FIGURE 7
FIGURE 7
Effects of scavengers or inhibitors of ROS production on mitochondrial oscillations. Conditions are as described in the legend of Fig. 3. Recordings of the TMRE signal of myocytes showing cell-wide mitochondrial oscillations after a laser flash (arrows) in the absence (A) or in the presence of 4 mM n-acetyl-L-cysteine (L-NAC) for 30 min (B), or 10 μg/ml of oligomycin for 60 min (C), or after the acute addition of rotenone (15 μM) (D).
FIGURE 8
FIGURE 8
Glutathione oscillations. (A) Simulation of glutathione (GSH) oscillations (100-s period) under the same parametric conditions described in Fig. 4, CE. (B) Experimental demonstration of GSH oscillations (∼70 s period) recorded simultaneously with ΔΨm. Freshly isolated cardiomyocytes were loaded with 100 nM TMRM and 50 μM MCB, as described in Methods. Oscillations were triggered after a localized laser flash, as previously described (Aon et al., 2003). Arrow indicates the timing of the flash. The decrease in the GSB signal corresponds to a drop in the reduced glutathione pool (see text for further explanation).
FIGURE 9
FIGURE 9
Modulation of the oscillation period through changes in the rate of ROS scavenging. The bifurcation diagram for ΔΨm of the complete model as a function of SOD concentration is depicted. The model parameters used to run the simulations for shunt = 0.0744 were the same as those described in the legend of Fig. 5. Oscillation periods of 25 ms, 143 ms, 5 s, and 55 min were observed for SOD concentrations of 0.75 μM, 1.07 μM, 1.50 μM, and 2.20 μM, respectively.
FIGURE A1
FIGURE A1
Scheme of the possible pathway of ROS generation in the electron transport chain. The two possible sites of ROS generation at the level of Complexes I and III in the respiratory chain are shown along with the sites of action of several inhibitors (reproduced from Aon et al., 2003, J. Biol. Chem., with permission).
FIGURE A2
FIGURE A2
Dependence of the rate of formula image generation on NADH and ΔΨm. The rate of formula image production, modeled as in Eq. A8 (in mM s−1), was studied as a function of the redox potential, varied through the concentration of NADH, and the membrane potential, ΔΨm, expressed in V units. For a more explicit expression of VO2 see Eq. 26 in Cortassa et al. (2003). The parameters used are: ρres = 0.012 mM; ΔpH = −0.6; and shunt = 0.05.
FIGURE A3
FIGURE A3
Rate of formula image generation as function of NADH concentration. (a) The rate of formula image production at Complex I was modeled according to Kushnareva et al. (2002). In the calculation, we assume that most of the electron donor is in the nonreduced state and that there is an equilibrium relationship between the NADH/NAD+ couple and the electron donor site in its reduced and oxidized state (see Eqs. A1 and A2). The equilibrium constant between NADH and the electron donor was considered equal to 0.01 and the rate constant k′ = 1.0 mM−1 s−1. (b) The rate of formula image production was studied as a function of ΔΨm according to the minimal model described in Demin and co-workers (reproduced from Demin et al., 1998, Mol. Cell Biochem., with permission).
FIGURE A4
FIGURE A4
Kinetics of superoxide dismutase (SOD). The activity of SOD in mM s−1 (ruled by Eq. A3) is plotted as a function of the concentration of formula image and H2O2 (both in mM units). The parameters used in the plot are those indicated in Table A1 and formula image is 1.0 μM.
FIGURE A5
FIGURE A5
Kinetics of catalase activity. Catalase activity (ruled by Eq. A4) is plotted as a function of millimolar concentrations of H2O2. All the parameters in Eq. A5 are as indicated in Table A1.

Similar articles

Cited by

References

    1. Aebi, H. 1984. Catalase in vitro. Methods Enzymol. 105:121–126. - PubMed
    1. Aon, M. A., and S. Cortassa. 1997. Dynamic Biological Organization. Fundamentals as Applied to Cellular Systems. Chapman & Hall, London, UK.
    1. Aon, M. A., S. Cortassa, E. Marban, and B. O'Rourke. 2003. Synchronized whole-cell oscillations in mitochondrial metabolism triggered by a local release of reactive oxygen species in cardiac myocytes. J. Biol. Chem. 278:44735–44744. - PubMed
    1. Aon, M. A., S. Cortassa, and B. O'Rourke. 2004. Percolation and criticality in a mitochondrial network. Proc. Natl. Acad. Sci. USA. 101:4447–4452. - PMC - PubMed
    1. Bak, P., C. Tang, and K. Wiesenfeld. 1987. Self-organized criticality: an explanation of the 1/f noise. Phys. Rev. Lett. 59:381–384. - PubMed

Publication types

MeSH terms