. 2004 Sep;87(3):2086-97.
doi: 10.1529/biophysj.104.042960.

Microscopic Kinetics of DNA Translocation through synthetic nanopores

Affiliations

Microscopic Kinetics of DNA Translocation through synthetic nanopores

Aleksij Aksimentiev et al. Biophys J. 2004 Sep.

Abstract

We have previously demonstrated that a nanometer-diameter pore in a nanometer-thick metal-oxide-semiconductor-compatible membrane can be used as a molecular sensor for detecting DNA. The prospects for using this type of device for sequencing DNA are avidly being pursued. The key attribute of the sensor is the electric field-induced (voltage-driven) translocation of the DNA molecule in an electrolytic solution across the membrane through the nanopore. To complement ongoing experimental studies developing such pores and measuring signals in response to the presence of DNA, we conducted molecular dynamics simulations of DNA translocation through the nanopore. A typical simulated system included a patch of a silicon nitride membrane dividing water solution of potassium chloride into two compartments connected by the nanopore. External electrical fields induced capturing of the DNA molecules by the pore from the solution and subsequent translocation. Molecular dynamics simulations suggest that 20-basepair segments of double-stranded DNA can transit a nanopore of 2.2 x 2.6 nm(2) cross section in a few microseconds at typical electrical fields. Hydrophobic interactions between DNA bases and the pore surface can slow down translocation of single-stranded DNA and might favor unzipping of double-stranded DNA inside the pore. DNA occluding the pore mouth blocks the electrolytic current through the pore; these current blockades were found to have the same magnitude as the blockade observed when DNA transits the pore. The feasibility of using molecular dynamics simulations to relate the level of the blocked ionic current to the sequence of DNA was investigated.


Figures

FIGURE 1
FIGURE 1
Experimental setup for measuring DNA electrical signatures. Driven by the electrical field between two electrodes, DNA transits a pore in a thin, synthetic membrane, inducing a transient blockade of the ionic current, measured by the amplifier. (Left) Snapshot of DNA transiting the pore. (Right) An exemplary ionic current signature registered by an Axopatch 200B amplifier, when 600-basepair double-stranded DNA transits the 2.4 ± 0.2-nm diameter pore in a 30-nm thick Si3N4 membrane (Heng et al., 2004). The inset shows a transmission electron micrograph of the pore sculptured by a highly focused electron beam (C. Ho, unpublished data).
FIGURE 2
FIGURE 2
Open pore ionic currents. Symbols indicate three geometrically different nanopores. Dashed lines interpolate the linear current-voltage dependences observed at small voltages. The inset shows ionic currents at small voltages; stars indicate the points used to draw the linear interpolation. The geometry of the pores is defined through Eq. 1 as: (circles) a1 = a2 = 14.4 nm, b1 = b2 = 12.2 nm, φ1φ2 = 0, α = 0.039; (squares) a1 = a2 = 1.0 nm, b1 = b2 = 0.7 nm, φ1φ2 = π/2, α = 0.02; (diamonds) a1 = a2 = 0.67 nm, b1 = b2 = 0.55 nm, φ1φ2 = π/6, α = 0.02. All pores were made in a 5.2-nm-thick Si3N4 membrane.
FIGURE 3
FIGURE 3
Experimental measurements show the corresponding current-voltage characteristics measured at 23.5 ± 1°C in the range ±1 V in 1 M KCl electrolyte after >29 h of immersion in deionized water. The linear slope of a least-squares fit (yellow dashed lines) through the data yields a conductance of 0.64 ± 0.03 nS, 1.09 ± 0.03 nS, and 1.23 ± 0.03 nS for pores with an effective diameter of 0.95 nm, 2 nm, and 2.9 nm, respectively. The insets are top-down transmission electron micrographs of three pores with effective diameters of 0.95 ± 0.2 nm, 2.0 ± 0.2 nm, and 2.9 ± 0.2 nm in Si3N4 membranes that we estimate to be 10 ± 2-nm thick.
FIGURE 4
FIGURE 4
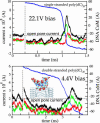
Electrophoresis of DNA through nanopores. Green, red, and black lines indicate Cl, K+, and total ionic currents, respectively, which are shown at the left vertical axes. Blue lines represent the position of the DNA center of mass relative to the center of the Si3N4 membrane, which is shown at the right vertical axes. Vertical dashed lines mark the moment when DNA is placed in front of the pore (see Methods); horizontal dashed lines indicate the open pore currents. (Top) Electrophoresis of single-stranded DNA through a 1.3 × 1.5 nm2 pore. (Bottom) Electrophoresis of double-stranded DNA through a 2.2 × 2.6 nm2 pore. The exact geometry of both pores is defined in the caption to Fig. 2. Rapid translocation of DNA is facilitated by its stretching. The transient increase of the ionic current above the open pore level results from clouds of Cl and K+ ions that are released when DNA exits the pore rapidly. The inset shows a typical DNA conformation at the moment when DNA enters the pore.
FIGURE 5
FIGURE 5
Slow electrophoresis of double-stranded DNA. The black line indicates the total ionic current (left axis); the gray line depicts the position of the DNA center of mass relative to the center of the Si3N4 membrane. The inset shows a cumulative current of Cl and K+ ions. The highlighted regions correspond to the four plateaus in the ionic current signature (see text). The cross section of the narrowest part of the pore is 2.2 × 2.6 nm2. Snapshots from this simulation are shown in Fig. 6.
FIGURE 6
FIGURE 6
Snapshots of DNA conformations during slow electrophoresis. (a) Beginning of the simulation. (b) The moment when the terminal Watson-Crick basepair splits at the narrowest part of the pore. (c) A moment during the time interval of 8 ns that DNA spends in the conformation shown without moving. (d) The moment when DNA exits the pore while one base at the DNA end remains firmly attached to the surface of the nanopore. (e) End of the simulation, when most of the DNA has left the pore and the ionic current has returned to the open pore level. Fig 5 illustrates the ionic currents and defines conditions of this simulation.
FIGURE 7
FIGURE 7
DNA-nanopore interaction. (a) Single-stranded poly(dC)20 adheres with three nucleotide bases to the Si3N4 surface; the interacting bases are shown in mauve. (b) The terminal Watson-Crick basepair of double-stranded poly(dC)20·poly(dG)20 splits spontaneously inside the pore; the freed bases adhere to the Si3N4 surface. Two strands of DNA are shown in different colors; the bases interacting hydrophobically with the Si3N4 surface are shown in vdW representation; only water molecules within 5 Å of the terminal nucleotides are shown explicitly. Water molecules are found to be excluded from the sites where DNA bases adhere to the nanopore wall.
FIGURE 8
FIGURE 8
Blocking current without translocation. (a) Double-stranded poly(dC)20·poly(dG)20 is placed in front of the pore. (b) Driven by a 1.4-V bias, DNA enters the pore blocking the ionic current. (c) The ionic current (solid line) and the DNA center of mass (dashed line) as a function of time. Black and red traces correspond to the applied biases of 1.4 V and 0.44 V. Although the DNA molecule cannot transit the pore, the blockage induced is comparable to that when DNA transits the pore (c.f. Fig. 5). The pore has the same dimensions as in Fig. 5.
FIGURE 9
FIGURE 9
DNA electrophoresis at different voltage biases. Four simulations were conducted starting from the conformation shown in the inset. The lines indicate the location of the DNA center of mass. At 1.4-V bias, spontaneous unzipping of the terminal basepair (at 9 ns) shifts the DNA CoM by 1 Å up.
FIGURE 10
FIGURE 10
Histogram of transient times when a 58-mer of single-stranded DNA interacts with a 2.0 nm ± 0.2 nm diameter pore in a Si3N4 membrane at a voltage of 1 V. There are two peaks associated with the histogram centered at transit times of 0.2 ms and 1.8 ms. The inset shows the current reduction percentage versus duration of the current blockades of the same events.
FIGURE 11
FIGURE 11
Sequence dependence of current blockades. (Top) Cumulative ionic currents through a 0.9 × 1.1 nm2 pore blocked by homopolymers of A, C, G, and T nucleotides. The traces show no sequence specificity. (Bottom) Cumulative ionic currents through a 2.2 × 2.6 nm2 pore blocked by poly(dC)20·poly(dG)20 and poly(dA)20·poly(dT)20 double strands. The AT strand blocks the current 25% less than does the CG strand. The fluctuations of the ionic current in the CG trace are larger than the sequence-dependent difference of the ionic currents.

Similar articles

Cited by

References

    1. Akenson, M., D. Branton, J. J. Kasianowicz, E. Brandin, and D. W. Deamer. 1999. Microsecond timescale discrimination among polycytidylic acid, polyadenylic acid, and polyuridylic acid as homopolymers or as segments within single RNA molecules. Biophys. J. 77:3227–3233. - PMC - PubMed
    1. Allen, M. P., and D. J. Tildesley. 1987. Computer Simulation of Liquids. Oxford University Press, New York.
    1. Ambjörnsson, T., S. P. Apell, Z. Konkoli, E. A. D. Marzio, and J. J. Kasianowicz. 2002. Charged polymer membrane translocation. Biophys. J. 117:4063–4073.
    1. Balaeff, A., C. R. Koudella, L. Mahadevan, and K. Schulten. 2004. Modeling DNA loops using continuum and statistical mechanics. Philos. Trans. R. Soc. Lond. A. In press. - PubMed
    1. Batcho, P. F., D. A. Case, and T. Schlick. 2001. Optimized particle-mesh Ewald/multiple-time step integration for molecular dynamics simulations. J. Chem. Phys. 115:4003–4018.

Publication types

LinkOut - more resources