. 2004 Nov;87(5):3493-503.
doi: 10.1529/biophysj.104.047589. Epub 2004 Sep 3.

Mobile actin clusters and traveling waves in cells recovering from actin depolymerization

Affiliations

Mobile actin clusters and traveling waves in cells recovering from actin depolymerization

Günther Gerisch et al. Biophys J. 2004 Nov.

Abstract

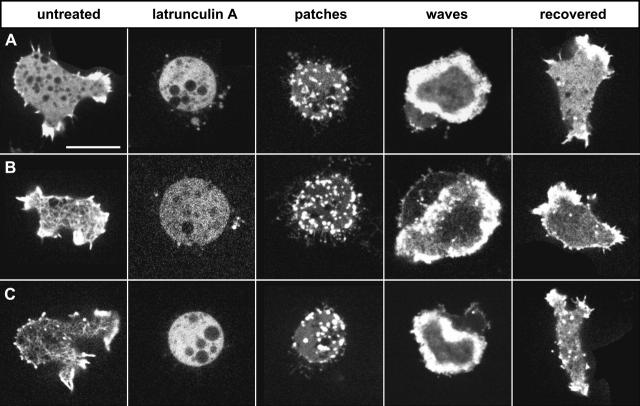
At the leading edge of a motile cell, actin polymerizes in close apposition to the plasma membrane. Here we ask how the machinery for force generation at a leading edge is established de novo after the global depolymerization of actin. The depolymerization is accomplished by latrunculin A, and the reorganization of actin upon removal of the drug is visualized in Dictyostelium cells by total internal reflection fluorescence microscopy. The actin filament system is reorganized in three steps. First, F-actin assembles into globular complexes that move along the bottom surface of the cells at velocities up to 10 microm/min. These clusters are transient structures that eventually disassemble, fuse, or divide. In a second step, clusters merge into a contiguous zone at the cell border that spreads and gives rise to actin waves traveling on a planar membrane. Finally, normal cell shape and motility are resumed. These data show that the initiation of actin polymerization is separated in Dictyostelium from front protrusion, and that the coupling of polymerization to protrusion is a later step in the reconstitution of a leading edge.


Figures

FIGURE 1
FIGURE 1
Actin depolymerization by latrunculin A, and characteristic patterns of reorganization after removal of the drug by washing in phosphate buffer. The images represent confocal scans through cells of Dictyostelium discoideum at planes close to the substrate-attached cell surface. Structures labeled with three different probes are compared. (A) GFP-actin; (B) GFP-ABD120; and (C) LimEΔcoil-GFP. The panels show, from left to right, cells moving on a glass surface before the treatment with latrunculin A, showing leading-edge labeling with all three probes and actin network structures in B and C; cells after 16–20 min of incubation with 5 μM latrunculin A, in which the labels are uniformly distributed in the cytoplasm and only organelles are spared; patches are the first structures recognized after the wash-out of latrunculin A; waves are typical of a later stage of reorganization before normal cell shape is recovered. Patches are formed within the first 15 min after the removal of latrunculin A, waves are most abundant after 20 to 30 min, and recovered cells are observed after 40 min or longer. For A and B, probes were expressed in a wild-type background, for C the probe was expressed in LimE-null cells. Bar, 10 μm.
FIGURE 2
FIGURE 2
A cell expressing LimEΔcoil-GFP as in Fig. 1 C, double-labeled after fixation. The cell forming an actin wave was fixed at 25 min of recovery from latrunculin A treatment. (A) Phase contrast image; (B) TRITC-phalloidin; (C) anti-GFP antibody followed by secondary antibody conjugated with Alexa Fluor 488; (D) superposition of images B and C. Bar, 5 μm.
FIGURE 3
FIGURE 3
Actin profiles at leading edges, probed with LimE-GFP in LimE-null cells and monitored by TIRF microscopy. (A) High-fluorescence intensity at a leading edge relative to the actin network on bottom of the cell. (B) Profile taken from a time series showing that the cell on the right protrudes its leading edge between substrate and surface of the cell on the left. The leading edge on the right is evidently within the depth of TIRF illumination. (C) The fluorescence intensities along the bars in A (solid line) and B (dotted line) are plotted. Both profiles reveal a zone of high fluorescence intensity, which has a width at half-maximum of <1 μm and a sharp peak in the region behind the leading edge. The background in the extracellular space has been subtracted. In D, the temporal change of actin accumulation during movement of a leading edge over an area on the substrate is plotted as the mean of 11 measurements at different sites of the border (area size corresponding to 243 × 243 nm). A sharp turn from increase to decrease characterizes the temporal profile, which has an average width at half-maximum of 9 s. Fluorescence intensities plotted in C and D were recorded within the linear range of the CCD camera. To depict the filamentous network in A and B, the contrast had to be enhanced to the point that gradation of intensities within the leading edge became indistinguishable. Bar for A and B, 1 μm.
FIGURE 4
FIGURE 4
Disassembly of F-actin structures and membrane “pearling” induced by latrunculin A. The fluorescent label is LimE-GFP in LimE-null cells. (A) Time course of the disappearance of actin structures during the incubation of a cell with 5 μM latrunculin A. Time is indicated in seconds before (first frame) and after addition of the drug (following frames). Arrowheads in the 99-s frame point to dense actin assemblies that are transiently formed against the trend of overall depolymerization. (B) A cell incubated for 10 min with 5 μM latrunculin A, showing intense pearling in extensions of the cell surface. Bars, 5 μm in A; 10 μm in B.
FIGURE 5
FIGURE 5
Stages of recovery from latrunculin A. After an incubation period of 7 min with 5 μM of latrunculin A, the drug was removed by washing in phosphate buffer. Numbers indicate seconds after the beginning of the sequence, which starts at 12 min after the dilution. Actin reorganization is monitored by TIRF microscopy using LimEΔcoil-GFP as a probe in LimE-null cells. At the time of latrunculin A removal, no actin enriched structures were visible in the cell shown. Panels AF show this cell at consecutive stages of recovery. (A and B) Formation of actin patches on the substrate-attached surface of the cell body and along the pearled extensions, some of which are being retracted into the cell. (C) Cell border expanding after the accumulation of actin around the cell's periphery. (D) Waves of dense actin accumulation traveling beneath the substrate-attached cell surface, and recovery of actin network structures. (E) An intermediate stage showing dispersed actin assemblies. (F) Final stage of recovery. As in untreated cells, the actin system is differentiated into a basal network and dense assemblies. These are represented by foci distributed over the substrate-attached cell surface and by actin accumulation localized to the leading edges. Bar, 5 μm.
FIGURE 6
FIGURE 6
Tracks of actin-rich patches in a cell recovering from latrunculin A treatment after removal of the drug. The cell expressed LimEΔcoil-GFP in a LimE-null background and is shown at the beginning (left panels) and the end (right panels) of a period of 145 s. (A and D) TIRF images of the entire cell. (B and E) the area framed in A and B. (C) Selected tracks of patches, numbers in B, C, and E demarcating individual patches. Patches 1 and 2 underwent splitting. Patches 2 and 4 appeared and disappeared within the period analyzed. Patch 2 had a lifetime of 65 s up to its splitting into two patches. Arrows in C indicate direction of patch movement. The frame-to-frame interval was 5 s; circles in C indicate patch positions in consecutive frames.
FIGURE 7
FIGURE 7
Assembly of actin patches and protrusion of the cell border. (A) Sequence of TIRF images of a cell expressing LimEΔcoil-GFP in a LimE-null background. The cell was preincubated for 15 min with 5 μM latrunculin A. Numbers indicate seconds, starting at 4 min after dilution of the drug to 1 μM. The time series illustrates the formation of actin patches at the bottom surface of the cell, and expansion of the bottom area upon accumulation of the patches at the cell border. The line in the last frame indicates the scan direction for the kymograph in BE. Bar, 5 μm. (B) Line scan presented within the linear range of fluorescence intensities. The scan-to-scan interval is 5 s. This kymograph shows that fast spreading correlates with the accumulation of actin patches at the cell border. (C) Same plot as in B, but overexposed to demarcate the cell border. (D) Increase in cell diameter over time, calculated from the plot in C. (E) Velocity of cell border progression. Expansion of the cell diameter per minute was divided by 2 to obtain the average speed of cell border progression.
FIGURE 8
FIGURE 8
Actin wave dynamics related to spacing of the cell and glass surfaces. By dual wavelength TIRF microscopy the red fluorescence of the actin probe mRFP-LimEΔcoil in wild-type cells, and the green fluorescence of Alexa-Fluor 488 dextran within the space between cell and substrate surfaces were recorded simultaneously. Waves were induced by diluting latrunculin A from 5 μM to 1 μM. The cell is shown at four time points as indicated in seconds after the first frame. (A) Wave patterns labeled with mRFP-LimEΔcoil. (B) The fluorescence of Alexa-Fluor 488 dextran shows darkened areas indicating juxtaposition of the cell and glass surfaces. (The cell of interest is flanked by two other cells at the right border of the frames). (C) Superposition of the mRFP (red) and dextran (green) fluorescence. (D) Scan of fluorescence intensities emitted from Alexa-Fluor 488 dextran (green) and from the mRFP-LimEΔcoil label (red) along a line of 0.5 μm in width. This scanning coordinate is placed perpendicular to a traveling wave front as indicated by the white line in C. The red fluorescence reflects the displacement of actin accumulations, the highest peak corresponding to the wave travelling from the right to the left. The green fluorescence is reduced underneath the cell, owing to the proximity of cell and substrate surfaces. These curves do not show any deviations that would correlate with the peaks of the actin wave. Bar, 5 μm.
FIGURE 9
FIGURE 9
Labeling of actin patches and waves (green) combined with membrane labeling (red). Cells expressing GFP-LimEΔcoil in a wild-type background were preincubated for 11 min with 5 μM latrunculin A. After replacement of the drug by phosphate buffer, FM4-64 was added, a red fluorescing dye inserting into the plasma membrane and into the membrane of endosomes and vesicles of the contractile vacuole complex (Heuser et al., 1993; Gerisch et al., 2002). These intracellular vesicles are characterized by mobility which does not require polymerized actin, as shown in Movie 1. The sequence starts at 33 min after the removal of latrunculin A, and time thereafter is indicated in seconds. (A) GFP label; (B) FM4-64 label; (C) Superposition of the two labels upon each other. Arrowheads in the 37-s frame of C indicate sites where the wave propels the cell border forward. Bar, 5 μm.
FIGURE 10
FIGURE 10
Three-dimensional organization of polymerized actin assemblies related to cell shape before and during the treatment of cells with 5 μM latrunculin A and after its dilution to 1 μM. The left panels show surface-rendered reconstructions of actin structures labeled with LimEΔcoil-GFP (green) in LimE-null cells, and of the cell membrane labeled with FM4-64 (red). Numbers on the coordinates are micrometers. Surface rendering was performed with OpenDX software (http://www.opendx.org). The middle panels show sections parallel and close to the substrate-attached surface from the same stacks of z scans as used for the 3D reconstructions. The right panels show median cross-sections through these cells along the scanning coordinate indicated in the middle panels. (A) A normal cell protruding three fronts. (B) A latrunculin A-treated cell in which no actin-rich structures are detectable. In this case, surface rendering was not applicable because of the lack of any structure in the cell body with fluorescence intensities beyond the cytoplasmic background. (C) Early phase of recovery of actin polymerization characterized by mobile patches on the substrate-attached cell surface. (D) Transition phase at which actin clusters accumulate at the periphery to push the cell border outward. (E) Stage of actin wave propagation. Bar, 10 μm.

References

    1. Axelrod, D. 1981. Cell-substrate contacts illuminated by total internal-reflection fluorescence. J. Cell Biol. 89:141–145. - PMC - PubMed
    1. Axelrod, D. 2003. Total internal reflection fluorescence microscopy in cell biology. In Methods in Enzymology, Vol. 361, Biophotonics Part B. G. Marriott and I. Parker, editors. Academic Press, New York. 1–33. - PubMed
    1. Bar-Ziv, R., T. Tlusty, E. Moses, S. A. Safran, and A. Bershadsky. 1999. Pearling in cells: a clue to understanding cell shape. Proc. Natl. Acad. Sci. USA. 96:10140–10145. - PMC - PubMed
    1. Bretschneider, T., S. Diez, K. Anderson, J. Heuser, M. Clarke, A. Müller-Taubenberger, J. Köhler, and G. Gerisch. 2004. Dynamic actin patterns and Arp2/3 assembly at the substrate-attached surface of motile cells. Curr. Biol. 14:1–10. - PubMed
    1. Bretschneider, T., J. Jonkman, J. Köhler, O. Medalia, K. Barisic, I. Weber, E. H. K. Stelzer, W. Baumeister, and G. Gerisch. 2002. Dynamic organization of the actin system in the motile cells of Dictyostelium. J. Muscle Res. Cell Motil. 23:639–649. - PubMed

Publication types

MeSH terms

LinkOut - more resources