. 2004 Nov;87(5):3205-12.
doi: 10.1529/biophysj.104.047274. Epub 2004 Sep 3.

Nanopore unzipping of individual DNA hairpin molecules

Affiliations

Nanopore unzipping of individual DNA hairpin molecules

Jérôme Mathé et al. Biophys J. 2004 Nov.

Abstract

We have used the nanometer scale alpha-Hemolysin pore to study the unzipping kinetics of individual DNA hairpins under constant force or constant loading rate. Using a dynamic voltage control method, the entry rate of polynucleotides into the pore and the voltage pattern applied to induce hairpin unzipping are independently set. Thus, hundreds of unzipping events can be tested in a short period of time (few minutes), independently of the unzipping voltage amplitude. Because our method does not entail the physical coupling of the molecules under test to a force transducer, very high throughput can be achieved. We used our method to study DNA unzipping kinetics at small forces, which have not been accessed before. We find that in this regime the static unzipping times decrease exponentially with voltage with a characteristic slope that is independent of the duplex region sequence, and that the intercept depends strongly on the duplex region energy. We also present the first nanopore dynamic force measurements (time varying force). Our results are in agreement with the approximately logV dependence at high V (where V is the loading rate) observed by other methods. The extension of these measurements to lower loading rates reveals a much weaker dependence on V.


Figures
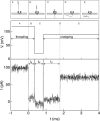
FIGURE 1
FIGURE 1
(Top panel) Cartoon depicting the state of the DNA hairpin with respect to the α-HL pore before and after unzipping. (A) The pore is open before the entry of the 3′ single-stranded overhang. (B) The ssDNA part enters and slides through the pore driven by the high electric field. (C) The hairpin is held at low voltage. (D) Unzipping and sliding of the molecule through the pore. (E) The pore is cleared. (Middle panel) Voltage applied across the pore as a function of time. The entry of the DNA inside the pore triggers the application of the voltage pattern shown at t = 0. (Lower panel) Pore current as a function of time. At t = 0 the DNA enters inside the pore, reducing the ionic current from ∼97 pA to ∼11 pA. The molecule is drawn inside the pore after its entry for a time td = 0.3 ms at 120 mV. Then the molecule is held in the pore during tH = 0.5 ms using a voltage, which does not induce unzipping (20 mV). The sharp spikes in the pore current at formula image and at formula image result from the abrupt changes in the applied voltage, as shown in the middle panel. Current traces were recorded with 100 KHz filter and sampled at 1 MHz. The data were smoothed with 10 KHz filter for display purposes.
FIGURE 2
FIGURE 2
Translocation time distribution of an ssDNA (poly(dA)90) measured at V = 120 mV and 15°C. The histogram was constructed from ∼1500 individual events. After formula image (the most probable translocation time), the distribution is fitted by a single exponential with a time constant of 0.32 ms.
FIGURE 3
FIGURE 3
Typical unzipping event for the constant voltage experiment. The upper panel displays the applied voltage pattern and the lower panel is the resulting pore current. The DNA enters the channel at time t = 0. The molecule is briefly pulled and held in the pore as explained in Fig. 1. At t = 0.8 ms, the unzipping voltage is applied (90 mV), but the current is blocked (lower level) until unzipping occurs at t = tU = 70 ms, as indicated by the abrupt increase in the current. (Inset) Typical distribution of the pore current measured at t = 5 ms from ∼1000 separate unzipping events. The numbers of events included in the two well-separated peaks can be used to calculate the fraction of unzipped molecules and, therefore, the unzipping probability.
FIGURE 4
FIGURE 4
The unzipping probability,Punzip as a function of t, for different unzipping voltage levels for HP1. PUNZIP was calculated as the ratio of the number of events under the high current peak to the total number of events (see inset of Fig. 3), for each probing time. The voltage levels used: 30 mV (circles), 60 mV (squares), 90 mV (triangles), 120 mV (inverted triangles), and 150 mV (diamonds). PUNZIP curves were fitted by single exponential functions formula image (solid lines).
FIGURE 5
FIGURE 5
The characteristic timescales obtained from the exponential fits of PUNZIP (Fig. 4) as a function of VU. Data are presented for the perfect match hairpin (HP1, solid circles) the single mismatch (HP2, triangles), and for the 7-bp hairpin (HP3, squares). The data are well approximated by exponential fits (lines) yielding an identical slope for the three hairpins with Vβ = 22 ± 2 mV, and intercept values τU(0) ∼ 2.1 ± 0.2 s, 1.2 ± 0.1 s, and 0.34 ± 0.05 s for HP1, HP2, and HP3, respectively.
FIGURE 6
FIGURE 6
Typical unzipping event under constant loading rate. (Upper panel) Voltage applied at time t = 0, which represents the triggering of the DNA entry into the pore. (Lower panel) Pore current during the controlled voltage ramp. The unzipping is readily observable by the jump of current during the ramp of the voltage, from the blocked pore current level to the open pore current level. The unzipping voltage, VU, is directly obtained from each event.
FIGURE 7
FIGURE 7
(Inset) Collection of ∼1500 unzipping events (as in Fig. 6) can be used to obtain the distribution of VU and the most probable unzipping voltage formula image The fit to Eq. 1 in the text is shown by the solid line. (Main figure) Semilog plot of VC as a function of the ramp formula image for HP1 (solid circles), HP2 (triangles,) and HP3 (squares). At high ramp values, VCVβ log(V̇), as is apparent from the plots. In this range, we used Eq. 2 to fit the data (solid lines), yielding similar slopes for the different molecules of formula image (see text). Notice that at low V̇, the data deviates from simple logarithmic dependence (see text).

References

    1. Akeson, M., D. Branton, J. Kasianowicz, E. Brandin, and D. Deamer. 1999. Microsecond timescale discrimination among polycytidylic acid, polyadenylic acid, and polyuridylic acid as homopolymers or as segments within single RNA molecules. Biophys. J. 77:3227–3233. - PMC - PubMed
    1. Alberts, B., D. Bray, J. Lewis, M. Raff, K. Roberts, and J. D. Watson. 1994. Molecular Biology of the Cell. Garland Publishing, New York.
    1. Bates, M., M. Burns, and A. Meller. 2003. Dynamics of DNA molecules in a membrane channel probed by active control techniques. Biophys. J. 84:2366–2372. - PMC - PubMed
    1. Bell, G. I. 1978. Models for the specific adhesion of cells to cells. Science. 200:618–627. - PubMed
    1. Bockelmann, U., B. Essevaz-Roulet, and F. Heslot. 1997. Molecular stick-slip motion revealed by opening DNA with piconewton forces. Phys. Rev. Lett. 79:4489–4492.

Publication types

MeSH terms

LinkOut - more resources