

LWR1 and LWR2 are required for osmoregulation and osmotic adjustment in Arabidopsis
- PMID: 15347788
- PMCID: PMC523345
- DOI: 10.1104/pp.104.045856
LWR1 and LWR2 are required for osmoregulation and osmotic adjustment in Arabidopsis
Abstract
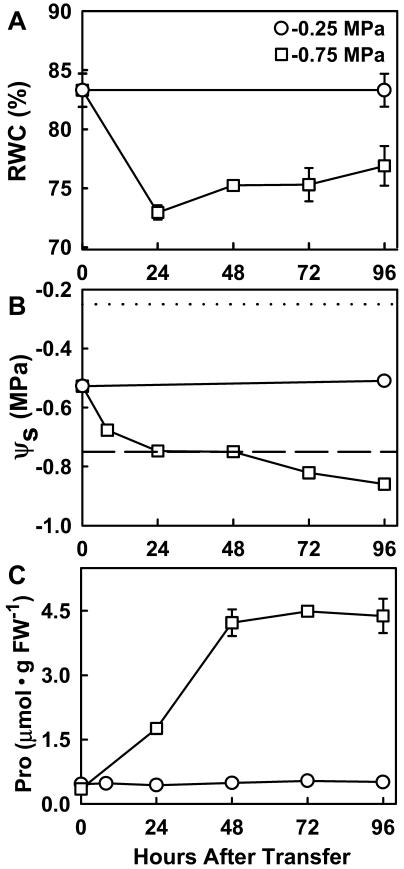
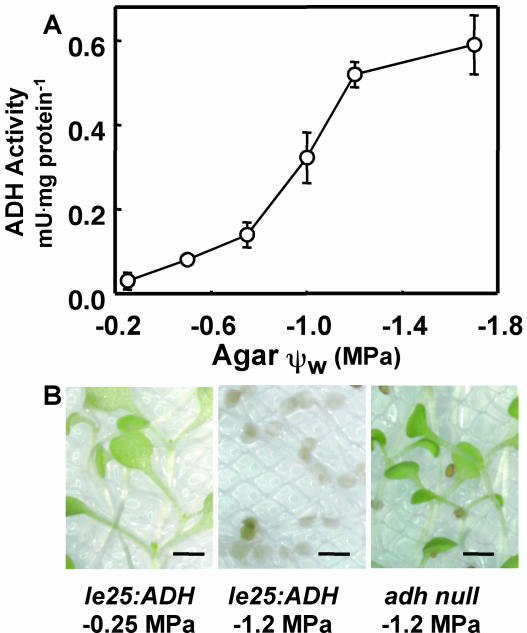
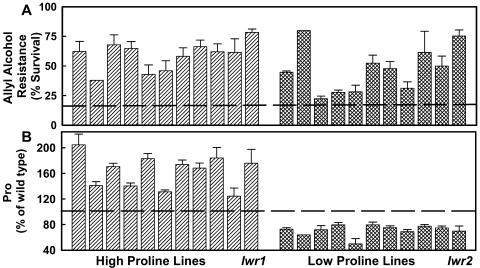
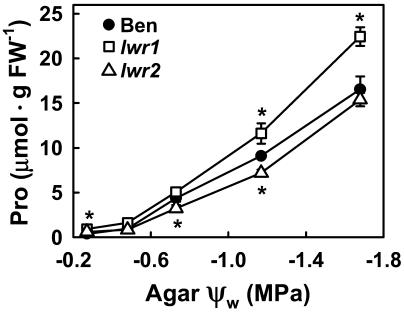
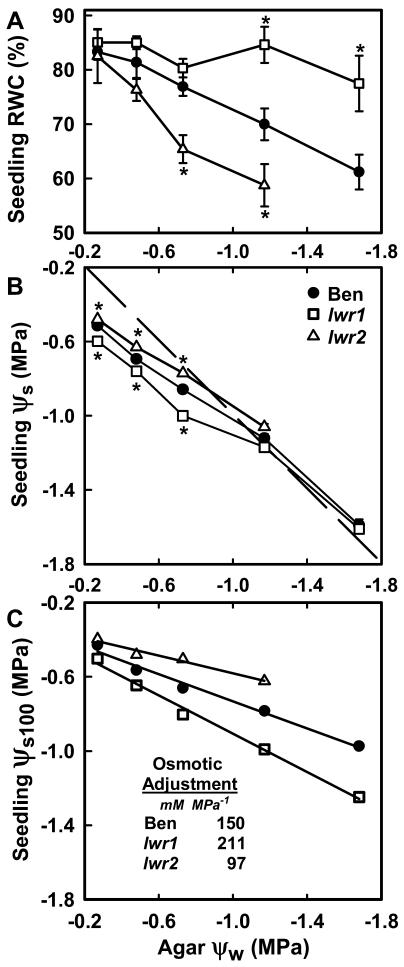
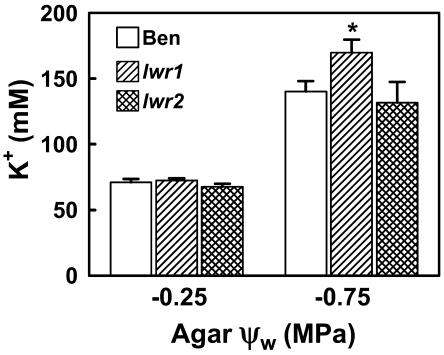
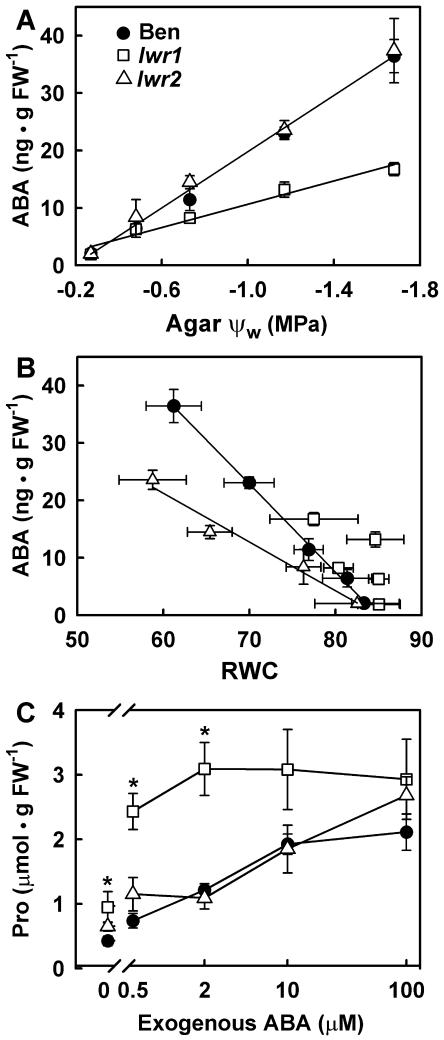
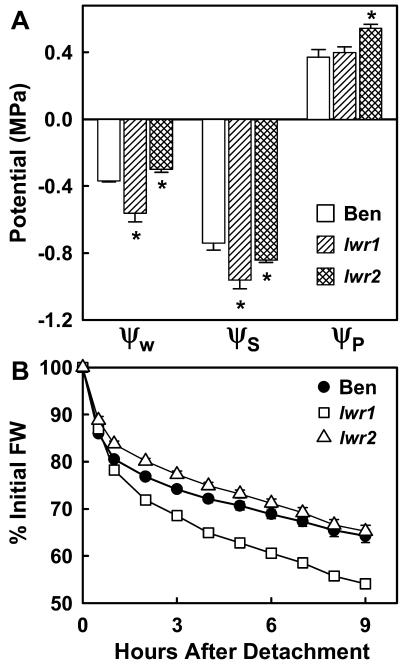
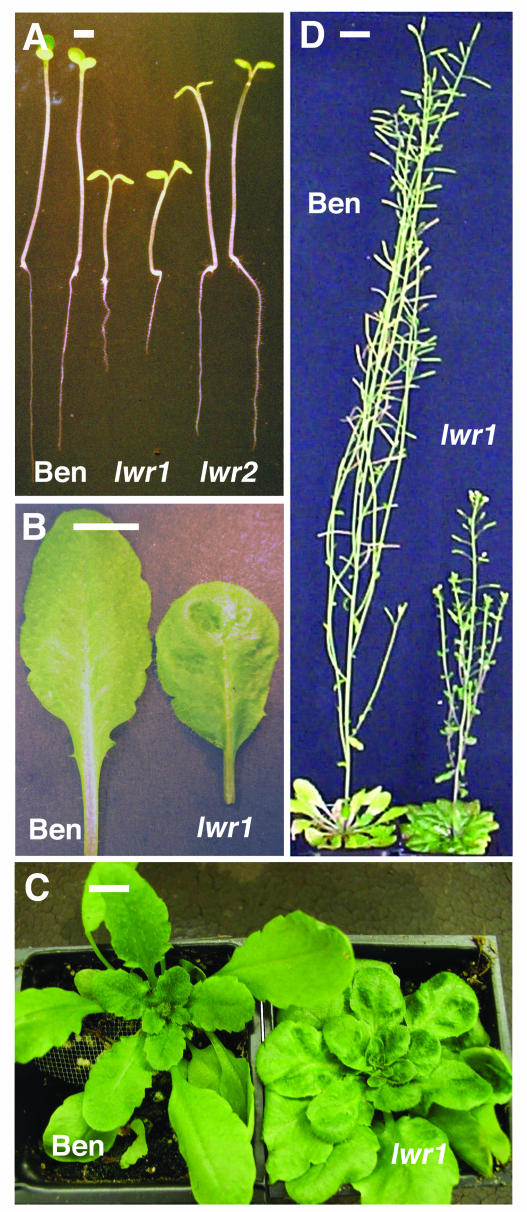
With the goal of identifying molecular components of the low-water-potential response, we have carried out a two-part selection and screening strategy to identify new Arabidopsis mutants. Using a system of polyethylene glycol-infused agar plates to impose a constant low-water-potential stress, putative mutants impaired in low-water-potential induction of the tomato (Lycopersicon esculentum) le25 promoter were selected. These lines were then screened for altered accumulation of free Pro. The seedlings of 22 mutant lines had either higher or lower Pro content than wild type when exposed to low water potential. Two mutants, designated low-water-potential response1 (lwr1) and lwr2, were characterized in detail. In addition to higher Pro accumulation, lwr1 seedlings had higher total solute content, greater osmotic adjustment at low water potential, altered abscisic acid content, and increased sensitivity to applied abscisic acid with respect to Pro content. lwr1 also had altered growth and morphology. lwr2, in contrast, had lower Pro content and less osmotic adjustment leading to greater water loss at low water potential. Both lwr1 and lwr2 also had altered leaf solute content and water relations in unstressed soil-grown plants. In both mutants, the effects on solute content were too large to be explained by the changes in Pro content alone, indicating that LWR1 and LWR2 affect multiple aspects of cellular osmoregulation.
Figures
Similar articles
-
Stress physiology functions of the Arabidopsis histidine kinase cytokinin receptors.Physiol Plant. 2015 Jul;154(3):369-80. doi: 10.1111/ppl.12290. Epub 2014 Nov 3. Physiol Plant. 2015. PMID: 25263537
-
Plastid osmotic stress activates cellular stress responses in Arabidopsis.Plant Physiol. 2014 May;165(1):119-28. doi: 10.1104/pp.114.236620. Epub 2014 Mar 27. Plant Physiol. 2014. PMID: 24676856 Free PMC article.
-
Role of abscisic acid (ABA) and Arabidopsis thaliana ABA-insensitive loci in low water potential-induced ABA and proline accumulation.J Exp Bot. 2006;57(1):201-12. doi: 10.1093/jxb/erj026. Epub 2005 Dec 9. J Exp Bot. 2006. PMID: 16339784
-
Role of the putative osmosensor Arabidopsis histidine kinase1 in dehydration avoidance and low-water-potential response.Plant Physiol. 2013 Feb;161(2):942-53. doi: 10.1104/pp.112.209791. Epub 2012 Nov 26. Plant Physiol. 2013. PMID: 23184230 Free PMC article.
-
Uncoupling the effects of abscisic acid on plant growth and water relations. Analysis of sto1/nced3, an abscisic acid-deficient but salt stress-tolerant mutant in Arabidopsis.Plant Physiol. 2004 Oct;136(2):3134-47. doi: 10.1104/pp.104.046169. Epub 2004 Oct 1. Plant Physiol. 2004. PMID: 15466233 Free PMC article.
Cited by
-
Mycelium-Like Networks Increase Bacterial Dispersal, Growth, and Biodegradation in a Model Ecosystem at Various Water Potentials.Appl Environ Microbiol. 2016 May 2;82(10):2902-2908. doi: 10.1128/AEM.03901-15. Print 2016 May 15. Appl Environ Microbiol. 2016. PMID: 26944849 Free PMC article.
-
Arabidopsis E3 Ubiquitin Ligases PUB22 and PUB23 Negatively Regulate Drought Tolerance by Targeting ABA Receptor PYL9 for Degradation.Int J Mol Sci. 2017 Aug 24;18(9):1841. doi: 10.3390/ijms18091841. Int J Mol Sci. 2017. PMID: 28837065 Free PMC article.
-
Time for a drought experiment: Do you know your plants' water status?Plant Cell. 2023 Jan 2;35(1):10-23. doi: 10.1093/plcell/koac324. Plant Cell. 2023. PMID: 36346190 Free PMC article.
-
Enhancing maize drought and heat tolerance: single vs combined plant growth promoting rhizobacterial inoculation.Front Plant Sci. 2024 Dec 10;15:1480718. doi: 10.3389/fpls.2024.1480718. eCollection 2024. Front Plant Sci. 2024. PMID: 39719935 Free PMC article.
-
Ectopic expression of ABSCISIC ACID 2/GLUCOSE INSENSITIVE 1 in Arabidopsis promotes seed dormancy and stress tolerance.Plant Physiol. 2007 Feb;143(2):745-58. doi: 10.1104/pp.106.084103. Epub 2006 Dec 22. Plant Physiol. 2007. PMID: 17189333 Free PMC article.
References
-
- Babu RC, Pathan MS, Blum A, Nguyen HT (1999) Comparison of measurement methods of osmotic adjustment in rice cultivars. Crop Sci 39: 150–158
-
- Bates LS, Waldren RP, Teare ID (1973) Rapid determination of free proline in water-stress studies. Plant Soil 39: 205–207
-
- Boyer JS (1982) Plant productivity and environment. Science 218: 443–448 - PubMed
Publication types
MeSH terms
Substances
LinkOut - more resources
Full Text Sources
Other Literature Sources
Medical
Molecular Biology Databases
