Protein interaction quantified in vivo by spectrally resolved fluorescence resonance energy transfer
- PMID: 15352875
- PMCID: PMC1134695
- DOI: 10.1042/BJ20040226
Protein interaction quantified in vivo by spectrally resolved fluorescence resonance energy transfer
Abstract
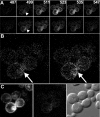
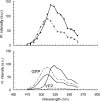
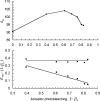
We describe a fluorescence resonance energy transfer (FRET)-based method for finding in living cells the fraction of a protein population (alpha(T)) forming complexes, and the average number (n) of those protein molecules in each complex. The method relies both on sensitized acceptor emission and on donor de-quenching (by photobleaching of the acceptor molecules), coupled with full spectral analysis of the differential fluorescence signature, in order to quantify the donor/acceptor energy transfer. The approach and sensitivity limits are well suited for in vivo microscopic investigations. This is demonstrated using a scanning laser confocal microscope to study complex formation of the sterile 2 alpha-factor receptor protein (Ste2p), labelled with green, cyan, and yellow fluorescent proteins (GFP, CFP, and YFP respectively), in budding yeast Saccharomyces cerevisiae. A theoretical model is presented that relates the efficiency of energy transfer in protein populations (the apparent FRET efficiency, E(app)) to the energy transferred in a single donor/acceptor pair (E, the true FRET efficiency). We determined E by using a new method that relies on E(app) measurements for two donor/acceptor pairs, Ste2p-CFP/Ste2p-YFP and Ste2p-GFP/Ste2p-YFP. From E(app) and E we determined alpha(T) approximately 1 and n approximately 2 for Ste2 proteins. Since the Ste2p complexes are formed in the absence of the ligand in our experiments, we conclude that the alpha-factor pheromone is not necessary for dimerization.
Figures


Similar articles
-
Fluorescence resonance energy transfer of GFP and YFP by spectral imaging and quantitative acceptor photobleaching.J Microsc. 2008 Jul;231(Pt 1):97-104. doi: 10.1111/j.1365-2818.2008.02020.x. J Microsc. 2008. PMID: 18638193
-
A flow cytometric method to detect protein-protein interaction in living cells by directly visualizing donor fluorophore quenching during CFP-->YFP fluorescence resonance energy transfer (FRET).Cytometry A. 2003 Oct;55(2):71-85. doi: 10.1002/cyto.a.10073. Cytometry A. 2003. PMID: 14505312
-
Flow cytometric measurement of fluorescence (Förster) resonance energy transfer from cyan fluorescent protein to yellow fluorescent protein using single-laser excitation at 458 nm.Cytometry A. 2003 May;53(1):39-54. doi: 10.1002/cyto.a.10037. Cytometry A. 2003. PMID: 12701131
-
Monitoring molecular interactions in living cells using flow cytometric analysis of fluorescence resonance energy transfer.Methods Mol Biol. 2004;261:371-82. doi: 10.1385/1-59259-762-9:371. Methods Mol Biol. 2004. PMID: 15064470 Review.
-
FRET Imaging by Laser Scanning Cytometry on Large Populations of Adherent Cells.Curr Protoc Cytom. 2014 Oct 1;70:2.23.1-29. doi: 10.1002/0471142956.cy0223s70. Curr Protoc Cytom. 2014. PMID: 25271960 Review.
Cited by
-
Two-photon excitation fluorescence microspectroscopy protocols for examining fluorophores in fossil plants.Commun Biol. 2024 Jan 6;7(1):53. doi: 10.1038/s42003-024-05763-z. Commun Biol. 2024. PMID: 38184735 Free PMC article.
-
Measuring the energetics of membrane protein dimerization in mammalian membranes.J Am Chem Soc. 2010 Mar 17;132(10):3628-35. doi: 10.1021/ja910692u. J Am Chem Soc. 2010. PMID: 20158179 Free PMC article.
-
Mechanistic insights from the atomic-level quaternary structure of short-lived GPCR oligomers in live cells.Res Sq [Preprint]. 2024 Jul 19:rs.3.rs-4683780. doi: 10.21203/rs.3.rs-4683780/v1. Res Sq. 2024. Update in: Commun Biol. 2025 Jul 1;8(1):966. doi: 10.1038/s42003-025-08374-4. PMID: 39070646 Free PMC article. Updated. Preprint.
-
Ab Initio Derivation of the FRET Equations Resolves Old Puzzles and Suggests Measurement Strategies.Biophys J. 2019 Apr 2;116(7):1313-1327. doi: 10.1016/j.bpj.2019.02.016. Epub 2019 Feb 26. Biophys J. 2019. PMID: 30885378 Free PMC article.
-
Quantitative microspectroscopic imaging reveals viral and cellular RNA helicase interactions in live cells.J Biol Chem. 2017 Jul 7;292(27):11165-11177. doi: 10.1074/jbc.M117.777045. Epub 2017 May 8. J Biol Chem. 2017. PMID: 28483922 Free PMC article.
References
-
- Lakowicz J. R. New York: Kluwer Academic/Plenum Publishers; 1999. Principles of Fluorescence Spectroscopy.
-
- Day R. N., Periasamy A., Schaufele F. Fluorescence resonance energy transfer microscopy of localized protein interactions in the living cell nucleus. Methods. 2001;25:4–18. - PubMed
MeSH terms
Substances
LinkOut - more resources
Full Text Sources
Other Literature Sources
Molecular Biology Databases
Miscellaneous

