Comparative Study
. 2004 Sep 13;166(6):775-85.
doi: 10.1083/jcb.200406049. Epub 2004 Sep 7.

Visualization of early chromosome condensation: a hierarchical folding, axial glue model of chromosome structure

Affiliations
Comparative Study

Visualization of early chromosome condensation: a hierarchical folding, axial glue model of chromosome structure

Natashe Kireeva et al. J Cell Biol. .

Abstract

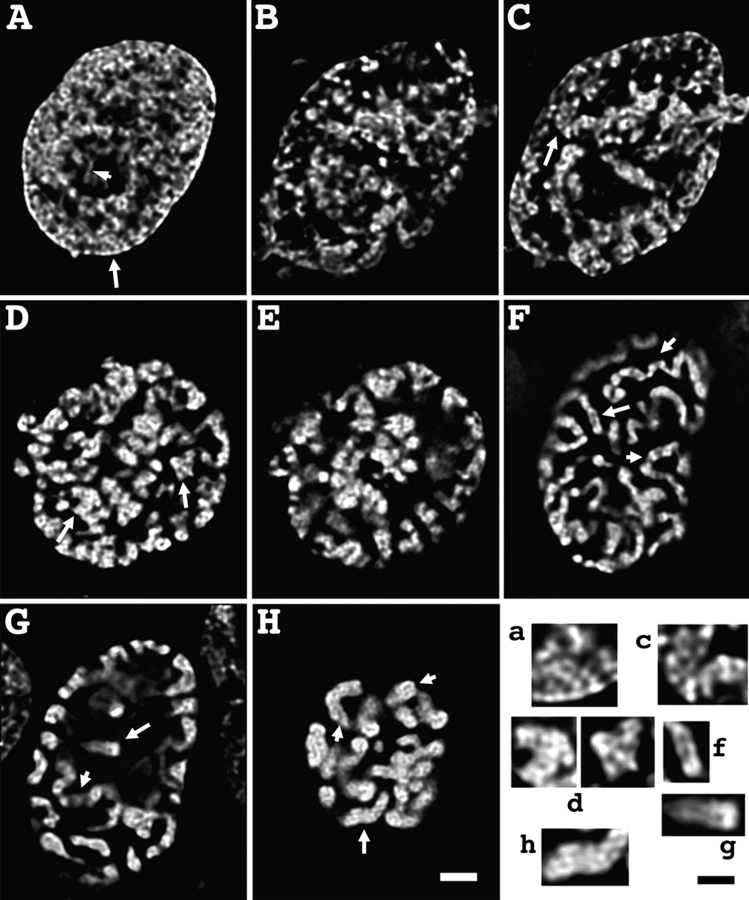
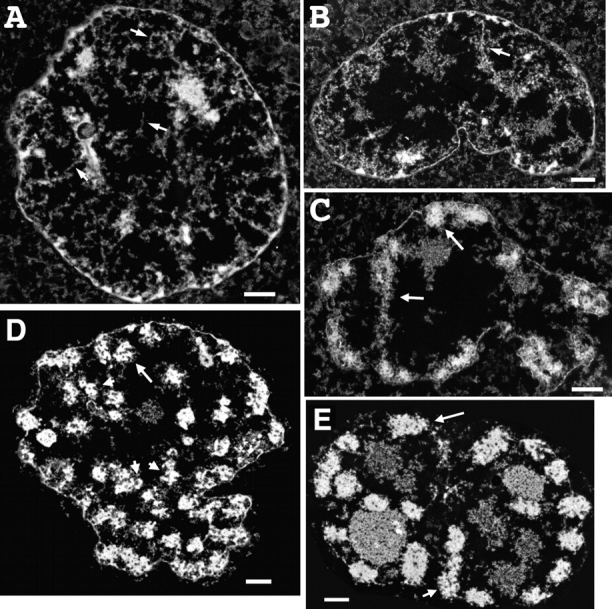
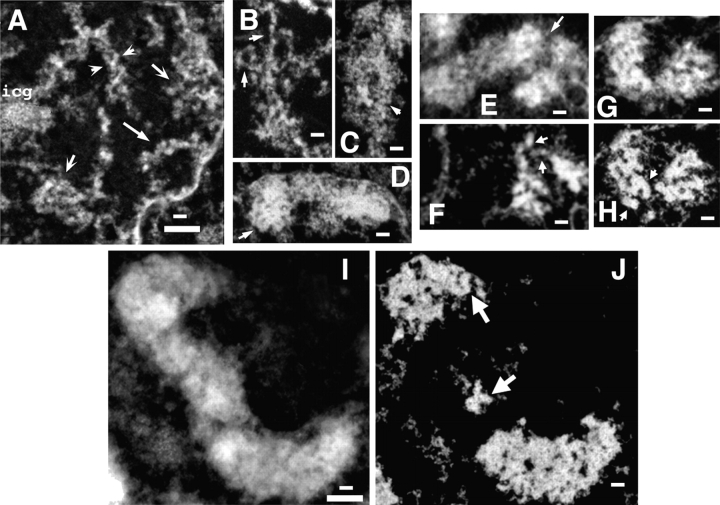
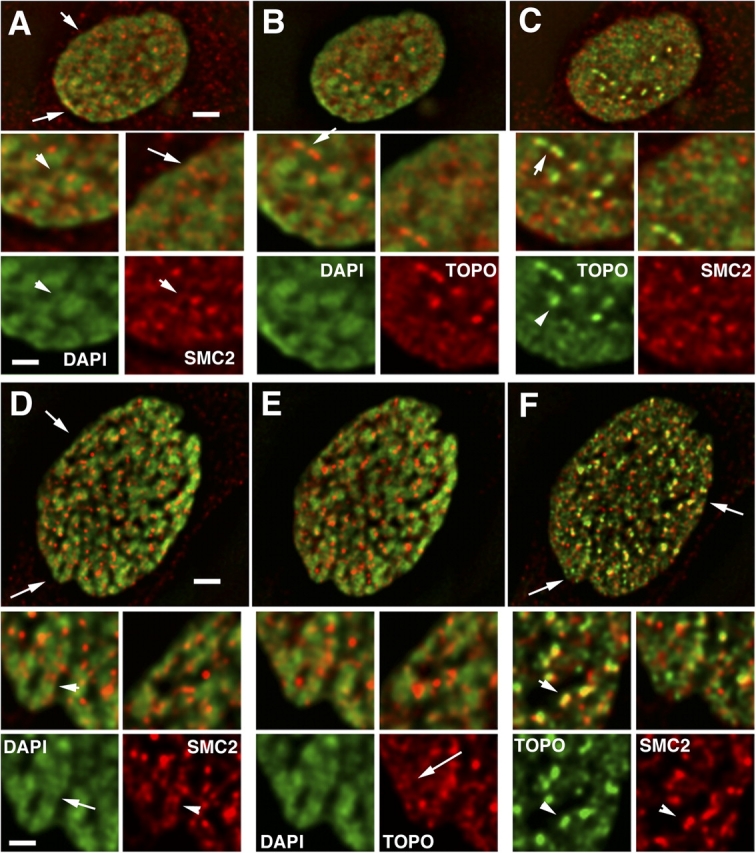
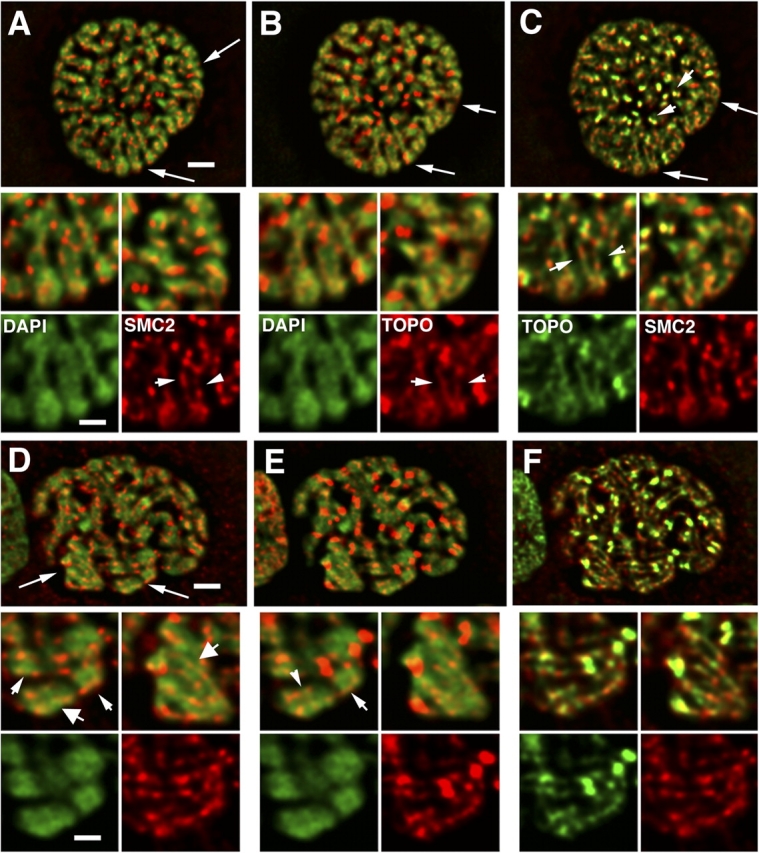
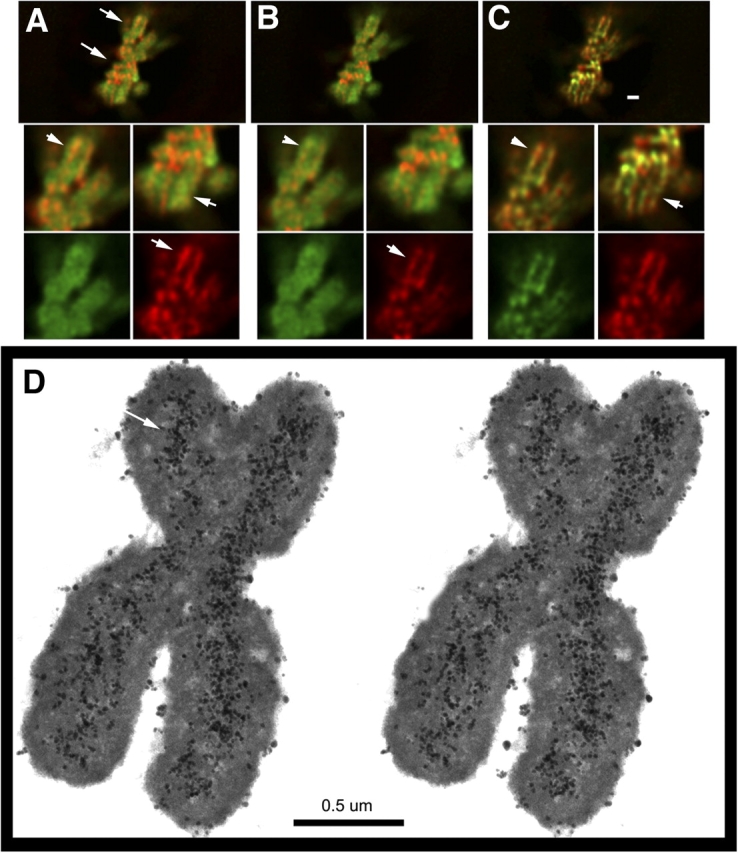
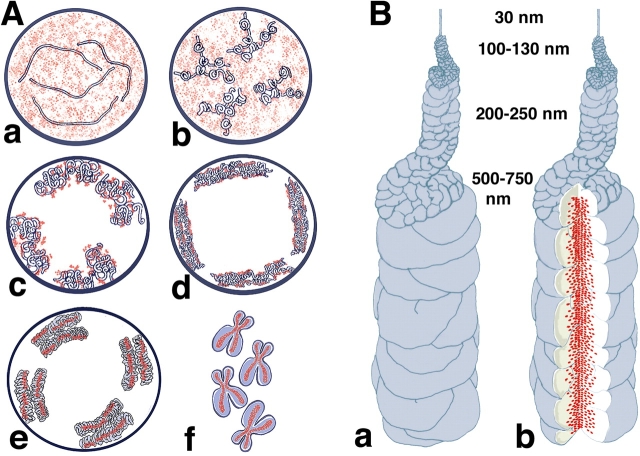
Current models of mitotic chromosome structure are based largely on the examination of maximally condensed metaphase chromosomes. Here, we test these models by correlating the distribution of two scaffold components with the appearance of prophase chromosome folding intermediates. We confirm an axial distribution of topoisomerase IIalpha and the condensin subunit, structural maintenance of chromosomes 2 (SMC2), in unextracted metaphase chromosomes, with SMC2 localizing to a 150-200-nm-diameter central core. In contrast to predictions of radial loop/scaffold models, this axial distribution does not appear until late prophase, after formation of uniformly condensed middle prophase chromosomes. Instead, SMC2 associates throughout early and middle prophase chromatids, frequently forming foci over the chromosome exterior. Early prophase condensation occurs through folding of large-scale chromatin fibers into condensed masses. These resolve into linear, 200-300-nm-diameter middle prophase chromatids that double in diameter by late prophase. We propose a unified model of chromosome structure in which hierarchical levels of chromatin folding are stabilized late in mitosis by an axial "glue."


Figures

Figure 1.
Figure 1.
Light microscope overview of prophase chromosome condensation. (A) G2 nucleus. Dispersed, apparently fibrillar substructure is distributed throughout the nuclear interior. Arrowhead points to isolated fiber segment. (B and C) Grazing (B) and mid-section (C) of very early prophase nucleus. Chromatin concentration in shell underlying nuclear periphery is becoming apparent. Condensation is highly heterogeneous, with dispersed fibrillar substructure coexisting with localized condensed chromosome regions (arrow). (D and E) Grazing (D) and mid-section (E) of early prophase nucleus. Distinct, individual chromosomes, concentrated near the periphery (E) cannot be visualized as uniform, extended, linear structures; however, condensed chromosomal regions can be followed as linear structures over short segments. (F and G) Grazing (F) and mid-section (G) of middle prophase nucleus. Chromosomes are ∼0.4–0.5 μm in diameter and can be traced (see short arrows) over extended distances. Sister chromatids can be distinguished as parallel structures (long arrow). Chromosomes are closely associated with nuclear periphery, with large regions of the interior free of chromosomes. (H) Late prophase/early prometaphase nucleus. Chromosomes are ∼0.8 μm in diameter; discrimination between sister chromatids is apparent at the tip of some chromosomes (arrowheads). Bottom right panel (a, c, d, f, g, and h) shows selected subregions, marked by long arrows, in A, C, D, F, G, and H. Bars: 2 μm (A–H), 1 μm (bottom right panel).
Figure 2.
Figure 2.
TEM survey of prophase chromosome condensation stages. (A–C) 200-nm-thick sections. (A) Nucleus with condensation typical of late S/G2 population. Chromatin is distributed throughout nuclear interior. Large-scale chromatin fibers ∼60–80 nm in diameter are present as extended fibers (arrows) or loosely folded and kinked within larger, often linear regions, typically 0.2–0.4 μm in diameter. (B) Very early prophase nucleus. Chromatin is now predominately peripherally located in an ∼1-μm shell underlying the nuclear envelope. Individual large-scale chromatin fibers are easily recognizable, but predominately folded within chromatin aggregates ∼1 μm in diameter (arrow points to region enlarged in Fig. 3 B). Distinct chromatids are not apparent. (C) Early prophase nucleus in which the chromosomal peripheral location and extensive interaction with nuclear envelope is obvious. Chromosome substructure consistent with folded large-scale chromatin fibers is evident in most chromosomal regions (arrows point to regions enlarged in Fig. 3, C and D). (D) Middle prophase nucleus. 80-nm-thick section shows condensed chromosomes, ∼0.4–0.5 μm diameter, containing ∼100–130-nm-diameter large-scale chromatin domains (arrowheads). Arrow points to chromosome region showing clear separation of the 0.2–0.25-μm-diameter sister chromatids. (E) Late prophase nucleus. 80-nm section shows nearly uniformly condensed chromosome cross sections in which substructure is difficult to discern, except at chromosome periphery and grazing sections; arrows point to chromosome regions showing substructure consistent with folded chromonema fibers. Bars, 1 μm.
Figure 3.
Figure 3.
Chromonema fibers can be visualized during all stages of prophase chromosome condensation. (A) Late S/G2 nucleus. 175-nm computational projection from five sections, each 35 nm thick. Arrows with curved arrowheads point to large condensed regions, curved arrowheads point to condensed linear segment. Arrow with straight arrowhead points to loose coiling of chromonema fiber into an ∼0.2-μm-wide segment. (B–D) Early prophase chromosomes. Enlarged regions from sections shown in Fig. 2, B and C (arrows). (B) Large-scale chromatin fibers (arrowheads) appear to be coalescing into nascent chromatid. (Fig. 2 B). (C and D) More condensed regions of early prophase chromosomes (Fig. 2 C) appear to contain folded large-scale chromatin fibers (arrowheads). (E–H) Middle prophase chromosomes. Computational projection (E) of 11 80-nm thick serial sections and individual section (F). Arrows (F) point to isolated chromonema fibers in chromosome constriction likely to be a centromere (E, arrow). (G) 0.24-μm projection through three sections and individual section (H) with arrowheads pointing to features suggestive of folded 100–130-nm chromonema fibers. Separation between sister chromatids, each ∼200–250 nm in diameter, are seen over right side of chromosome. (I and J) Late prophase nucleus. (I) computational projection (1.2 μm) through 15 serial sections and an individual section (J). Particularly in grazing sections, ∼100–130-nm-diameter features suggestive of chromonema fibers are present (arrows). Bars: 0.5 μm (long), 0.2 μm (short).
Figure 4.
Figure 4.
SMC2 and topoisomerase IIα staining in G2 and early prophase nuclei. (A and D) DAPI (green) vs. SMC2 (red); (B and E) DAPI (green) vs. topoisomerase IIα (red); (C and F) topoisomerase IIα (green) vs. SMC2 (red). Arrows (A–C, D–F) point to regions enlarged in insets. G2 nucleus (A–C). SMC2 appears in bright foci, largely between and on periphery of condensed DNA (A, inset, arrow). In some cases, SMC2 staining overlaps less condensed DNA regions (A, insets, arrowheads). Topoisomerase is distributed more diffusely over chromosomal regions, but is concentrated in bright doublets (C, arrowheads), likely representing centromeric regions (see text). Early prophase nucleus (D–F). SMC2 staining is now more obviously concentrated in small foci associated with chromosomes, but largely on the periphery. Short, parallel linear segments are beginning to appear (C, inset, arrowheads), but on the chromosome exterior. Where SMC2 staining is interior, it frequently appears to lie in areas of lower DAPI intensity (D, inset, arrow). Topoisomerase IIα is still located diffusely through chromosome regions (E, inset, arrow). However, now bright doublets of topoisomerase IIα staining frequently overlap bright doublet foci of SMC2 staining (F, inset, arrowheads). Bars: 2 μm (top panels), 1 μm (insets).
Figure 5.
Figure 5.
SMC2 and topoisomerase IIα staining in middle and late prophase nuclei. (A and D) DAPI (green) vs. SMC2 (red); (B and E) DAPI (green) vs. topoisomerase IIα (red); (C and F) topoisomerase IIα (green) vs. SMC2 (red). Arrows (A–C, D–F) point to regions enlarged in insets. Middle prophase (A–C). SMC2 and topoisomerase IIα staining is now becoming correlated, forming colinear segments, but largely on the chromosome exterior (A–C, insets, arrowheads). Arrowheads (C) point to colocalization of both in doublets, likely to be paired centromere regions. Late prophase (D–F). Correlation between SMC2 and topoisomerase IIα now very obvious, again forming colinear segments localizing sometimes on chromosome exterior (small arrowheads, insets), but in other locations toward the chromatid axis (large arrowheads, insets). Bars: 2 μm (A–F), 1 μm (insets).
Figure 6.
Figure 6.
Axial staining of SMC2 and topoisomerase IIα in metaphase chromosomes. (A–C) SMC2 and topoisomerase IIα staining. (A) DAPI (green), SMC (red); (B) DAPI (green), topoisomerase IIa (red); (C) topoisomerase IIα (green), SMC2 (red). Arrows point to enlarged regions in insets. Arrowheads in insets point to axial staining. Bar, 1 μm. (D) Immunogold SMC2 staining. Stereopair of semi-thick sections through metaphase chromosome. Silver-enhanced gold staining (arrows) reveals axial staining of SMC2 of ∼0.15–0.2 μm in width.
Figure 7.
Figure 7.
Models for chromosome condensation. (A) Stages of condensation. Changes in large-scale chromatin folding (blue) versus SMC2 distribution (red) from early S (a), G2 (b), early prophase (c), middle prophase (d), late prophase (e), and metaphase (f). See text for details. (B) “Hierarchical folding, axial glue” model of metaphase chromosome structure. (a) 30-nm fiber folds into 100–130-nm chromonema fiber, which folds into 200–250-nm middle prophase chromatid, which folds into 500–750-nm metaphase chromatid. Only one chromatid is shown here. (b) Axial condensin distribution (green) occupies approximately one third of the chromatid diameter, acting as cross-linking “glue” to stabilize metaphase chromosome.

References

    1. Belmont, A.S. 1998. Nuclear ultrastructure: transmission electron microscopy and image analysis. Methods Cell Biol. 53:99–124. - PubMed
    1. Belmont, A.S., and K. Bruce. 1994. Visualization of G1 chromosomes: a folded, twisted, supercoiled chromonema model of interphase chromatid structure. J. Cell Biol. 127:287–302. - PMC - PubMed
    1. Belmont, A.S., J.W. Sedat, and D.A. Agard. 1987. A three-dimensional approach to mitotic chromosome structure: evidence for a complex hierarchical organization. J. Cell Biol. 105:77–92. - PMC - PubMed
    1. Belmont, A.S., Y. Zhai, and A. Thilenius. 1993. Lamin B distribution and association with peripheral chromatin revealed by optical sectioning and electron microscopy tomography. J. Cell Biol. 123:1671–1685. - PMC - PubMed
    1. Boy de la Tour, E., and U.K. Laemmli. 1988. The metaphase scaffold is helically folded: sister chromatids have predominately opposite helical handedness. Cell. 55:937–944. - PubMed

Publication types

MeSH terms